Virgin Galactic (SPCE): Exploring Valuation as Investor Interest Picks Up
Virgin Galactic SPCE | 2.43 | +11.98% |
Virgin Galactic’s shares have swung higher this month with a 14.5% 1-month share price return, reflecting renewed optimism as the company edges closer to key commercial flight milestones. Still, momentum remains tempered by a 40.8% decline in total shareholder return over the past year, which keeps a lid on bullish sentiment.
If Virgin Galactic's recent volatility has piqued your curiosity, now is a great moment to broaden your investing horizons and discover See the full list for free.
The real question for investors is whether the recent uptick signals that Virgin Galactic is a bargain at these levels, or if the market already reflects all of its anticipated future growth in the share price.
Price-to-Book Ratio of 0.9x: Is It Justified?
Virgin Galactic currently trades at a price-to-book ratio of 0.9x, positioning it well below both industry peers and the wider Aerospace & Defense sector. With a last close price of $4.02, the market may be discounting the company’s future prospects heavily compared to the rest of the industry.
The price-to-book multiple compares a company’s market value to its book value, serving as a rough gauge of how investors value the business relative to its underlying assets. In high-growth or unprofitable sectors, this ratio often reflects investor sentiment about a company’s ability to turn assets into future profits.
Virgin Galactic’s low ratio hints that the market remains highly cautious. This is especially stark when set against the US Aerospace & Defense industry average of 3.7x and a peer average of 58.4x. This suggests significant skepticism about Virgin Galactic’s path to consistent profitability. The disparity could close if the company achieves its ambitious growth trajectory and delivers on commercial milestones.
Result: Price-to-Book of 0.9x (UNDERVALUED)
However, ongoing losses and the company’s challenging path to sustained profitability remain key risks. These factors could quickly dampen renewed investor confidence.
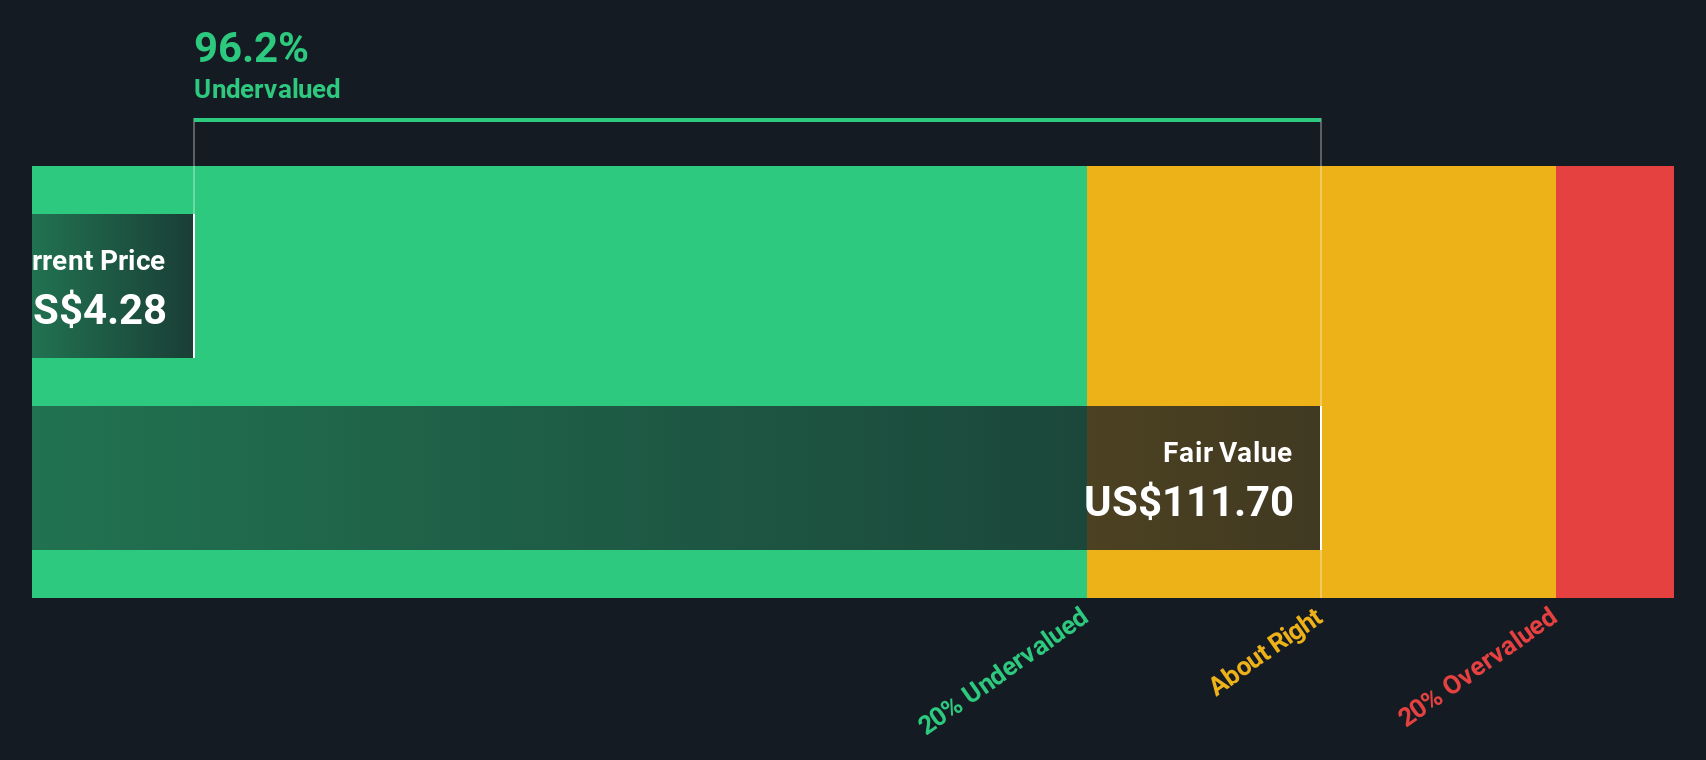
Another View: SWS DCF Model Points to Deeper Discount
While the price-to-book ratio suggests Virgin Galactic is undervalued compared to peers, our DCF model presents an even starker picture. According to the SWS DCF, the company's shares are trading roughly 96% below its estimated fair value. Does this present a hidden opportunity, or reflect deeper risks overlooked by conventional multiples?
Simply Wall St performs a discounted cash flow (DCF) on every stock in the world every day (check out Virgin Galactic Holdings for example). We show the entire calculation in full. You can track the result in your watchlist or portfolio and be alerted when this changes, or use our stock screener to discover 853 undervalued stocks based on their cash flows. If you save a screener we even alert you when new companies match - so you never miss a potential opportunity.
Build Your Own Virgin Galactic Holdings Narrative
If you're inspired to dive deeper or want to look at the numbers your own way, you can easily shape your own perspective in just a few minutes with Do it your way.
A great starting point for your Virgin Galactic Holdings research is our analysis highlighting 3 key rewards and 3 important warning signs that could impact your investment decision.
Looking for more investment ideas?
Smart investors keep their watchlist fresh. Get a head start by checking out other promising stocks that could make a real impact on your portfolio right now.
- Unlock the income potential in your investments when you tap into these 21 dividend stocks with yields > 3%, a selection of companies offering attractive yields above 3%.
- Ride the next tech wave by searching these 26 AI penny stocks, which features innovators transforming industries through artificial intelligence advancements.
- Find value others might have missed and scan these 853 undervalued stocks based on cash flows to spot stocks trading below their intrinsic cash flow worth.
This article by Simply Wall St is general in nature. We provide commentary based on historical data and analyst forecasts only using an unbiased methodology and our articles are not intended to be financial advice. It does not constitute a recommendation to buy or sell any stock, and does not take account of your objectives, or your financial situation. We aim to bring you long-term focused analysis driven by fundamental data. Note that our analysis may not factor in the latest price-sensitive company announcements or qualitative material. Simply Wall St has no position in any stocks mentioned.