W. R. Berkley (WRB) As Capital Discipline Supports A Narrative That The Stock Looks Fully Valued
W. R. Berkley Corporation WRB | 0.00 |
Short term performance snapshot
W. R. Berkley (WRB) has drawn attention after a recent move in its share price, with the stock last closing at $71.27 and posting gains over the past week and month.
The recent 1 day share price return of 2.86% extends a positive run that includes a 9.16% 30 day share price return and a 3 year total shareholder return of 94.25%, suggesting momentum has been building over a multi year period.
If you are looking beyond W. R. Berkley for other ideas in financials and insurance, it could be a good time to review a curated list of 20 top founder-led companies
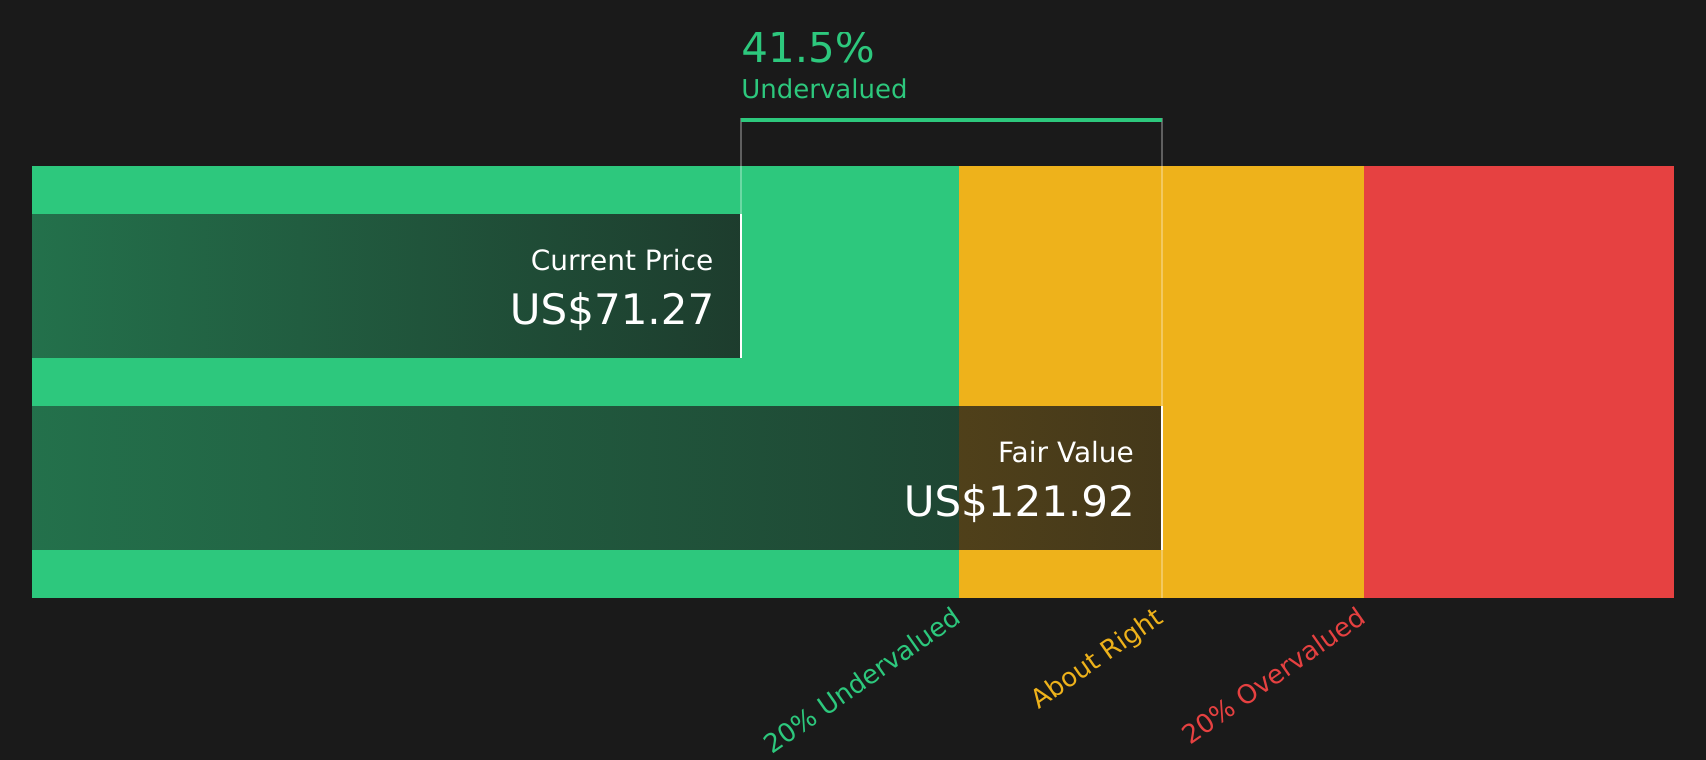
With W. R. Berkley trading around $71.27 and showing an intrinsic discount estimate of about 42%, the key question is whether investors are getting a mispriced insurer or if the market is already factoring in future growth.
Most Popular Narrative: 4% Overvalued
The most followed narrative currently pegs W. R. Berkley at a fair value of $68.33, slightly below the recent $71.27 close, framing the stock as modestly ahead of that central estimate.
Prudent capital management, shown by a growing investment portfolio benefitting from higher new money yields and conservative reserving, is increasing investment income and book value per share, laying a foundation for higher long-term earnings and the potential for resumed share buybacks.
Want to understand why this narrative sees W. R. Berkley as slightly rich at today’s price? The story hinges on steady earnings, cautious revenue assumptions, and a tighter valuation multiple that has quietly shifted over recent research updates.
Result: Fair Value of $68.33 (OVERVALUED)
However, you should weigh that story against rising competition and softer commercial pricing, along with the risk that loss costs outpace rates and squeeze W. R. Berkley margins.
Another View: W. R. Berkley Through A Cash Flow Lens
While the current narrative leans on earnings multiples and analyst targets, the Simply Wall St DCF model presents a different perspective, with W. R. Berkley at $71.27 compared with an estimated future cash flow value of $121.92, which implies the stock screens as materially undervalued. Which yardstick do you trust more when the signals conflict?
For a closer look at how this cash flow based view is built, including the key assumptions behind it, Look into how the SWS DCF model arrives at its fair value.
Simply Wall St performs a discounted cash flow (DCF) on every stock in the world every day (check out W. R. Berkley for example). We show the entire calculation in full. You can track the result in your watchlist or portfolio and be alerted when this changes, or use our stock screener to discover 44 high quality undervalued stocks. If you save a screener we even alert you when new companies match - so you never miss a potential opportunity.
Next Steps
Mixed messages in the W. R. Berkley story so far? Take a moment to review the numbers, weigh the concerns and optimism, and then ground your own view in the full picture of 2 key rewards and 1 important warning sign.
Looking for more investment ideas beyond W. R. Berkley?
If W. R. Berkley has sharpened your interest, do not stop here. Broaden your watchlist with other focused stock ideas that might otherwise stay off your radar.
- Spot potential deep value opportunities early by scanning a curated pool of 44 high quality undervalued stocks that combine quality fundamentals with discounted prices.
- Strengthen your income focus by reviewing 8 dividend fortresses that aim to pair higher yields with resilient cash flows.
- Prioritise resilience by assessing 71 resilient stocks with low risk scores that score well on balance sheet strength and volatility filters.
This article by Simply Wall St is general in nature. We provide commentary based on historical data and analyst forecasts only using an unbiased methodology and our articles are not intended to be financial advice. It does not constitute a recommendation to buy or sell any stock, and does not take account of your objectives, or your financial situation. We aim to bring you long-term focused analysis driven by fundamental data. Note that our analysis may not factor in the latest price-sensitive company announcements or qualitative material. Simply Wall St has no position in any stocks mentioned.