W. R. Berkley (WRB) Stock After Recent Sector Risk Focus Is The Price Still Attractive
W. R. Berkley Corporation WRB | 0.00 |
- If you are wondering whether W. R. Berkley stock offers good value at its current price, the key is understanding how that price lines up against a few different valuation yardsticks.
- The stock recently closed at US$71.01, with returns of 5.8% over the past week and 11.8% over the past month, while the 1 year return is a decline of 0.7% and the 3 year and 5 year returns sit at 93.2% and 137.0% respectively.
- Recent news coverage around W. R. Berkley has focused on the company's position in the insurance sector and how investors are weighing its risk profile against other financial stocks. This backdrop helps explain why some traders are reacting to company specific headlines as well as broader sector sentiment when moving in or out of the stock.
- On Simply Wall St's valuation framework, W. R. Berkley currently scores 2 out of 6 on undervaluation checks. The rest of this article will walk through the usual valuation methods, then finish with a way of thinking about valuation that can give an even clearer picture for long term investors.
W. R. Berkley scores just 2/6 on our valuation checks. See what other red flags we found in the full valuation breakdown.
Approach 1: W. R. Berkley Excess Returns Analysis
The Excess Returns model for W. R. Berkley looks at how efficiently the company is using shareholder capital, then compares that to the return investors require. Instead of focusing on cash flows, it starts with what is invested in the business and asks how much value is created on top of a basic required return.
For W. R. Berkley, the model uses a Book Value of $24.97 per share and a Stable EPS estimate of $5.44 per share, based on weighted future Return on Equity estimates from 11 analysts. The average Return on Equity used in the model is 17.73%. Against a Cost of Equity of $2.18 per share, this produces an Excess Return of $3.26 per share, indicating earnings in the model exceed the required shareholder return. The Stable Book Value assumption is $30.66 per share, based on estimates from 8 analysts.
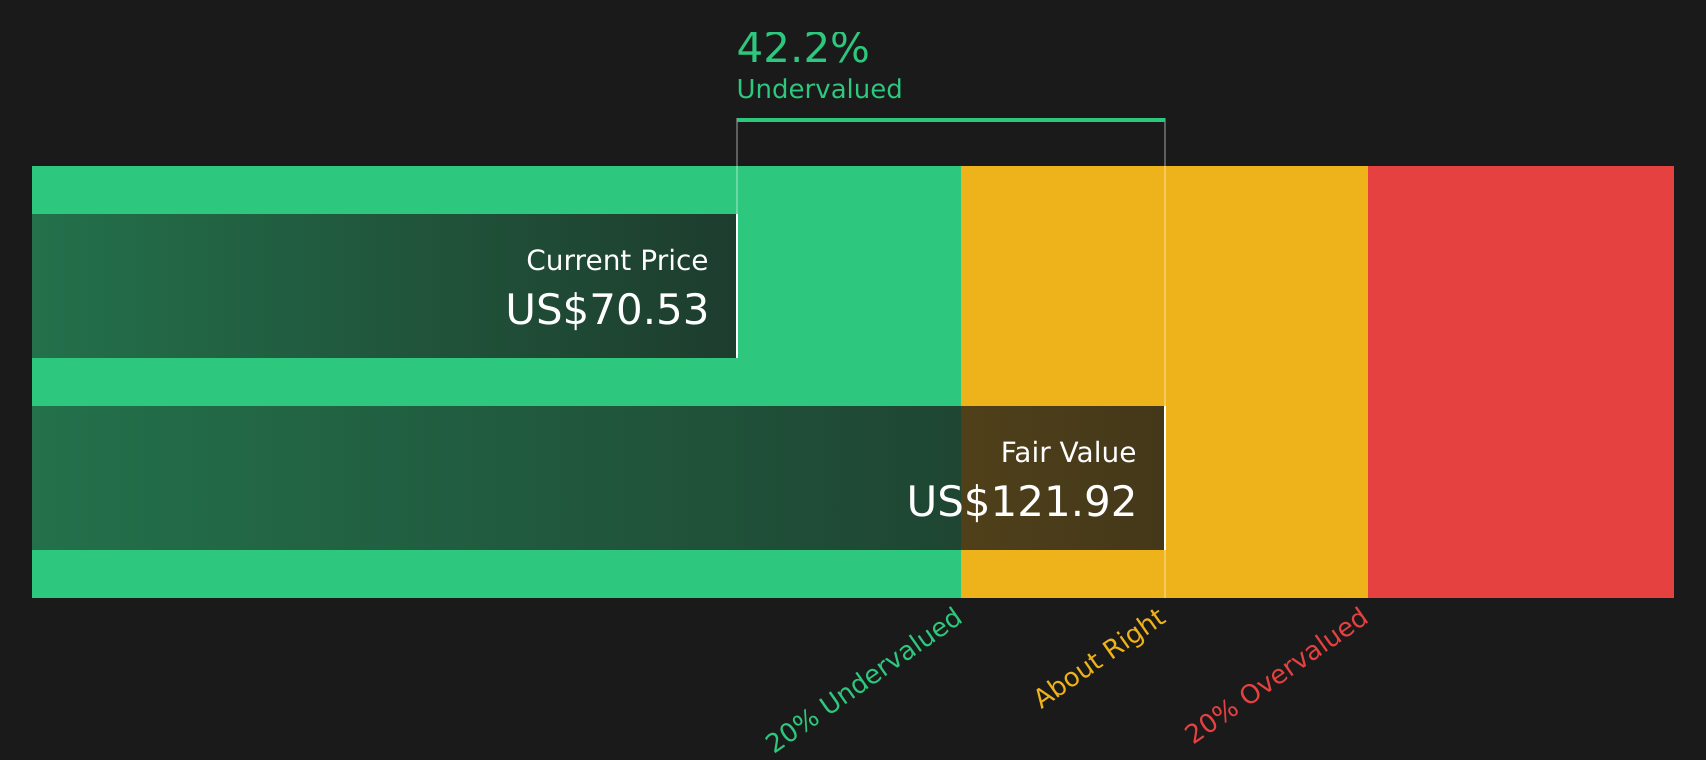
Combining these inputs, the Excess Returns approach produces an estimated intrinsic value of $121.92 per share, which is above the recent share price of $71.01. On this model, the stock is described as 41.8% undervalued.
Result: UNDERVALUED
Our Excess Returns analysis suggests W. R. Berkley is undervalued by 41.8%. Track this in your watchlist or portfolio, or discover 42 more high quality undervalued stocks.
Approach 2: W. R. Berkley Price vs Earnings
For a profitable company like W. R. Berkley, the P/E ratio is a useful way to think about what you are paying for each dollar of earnings. It links directly to how quickly earnings are expected to grow and how predictable those earnings appear, and investors usually accept a higher P/E when they expect stronger growth or see lower perceived risk.
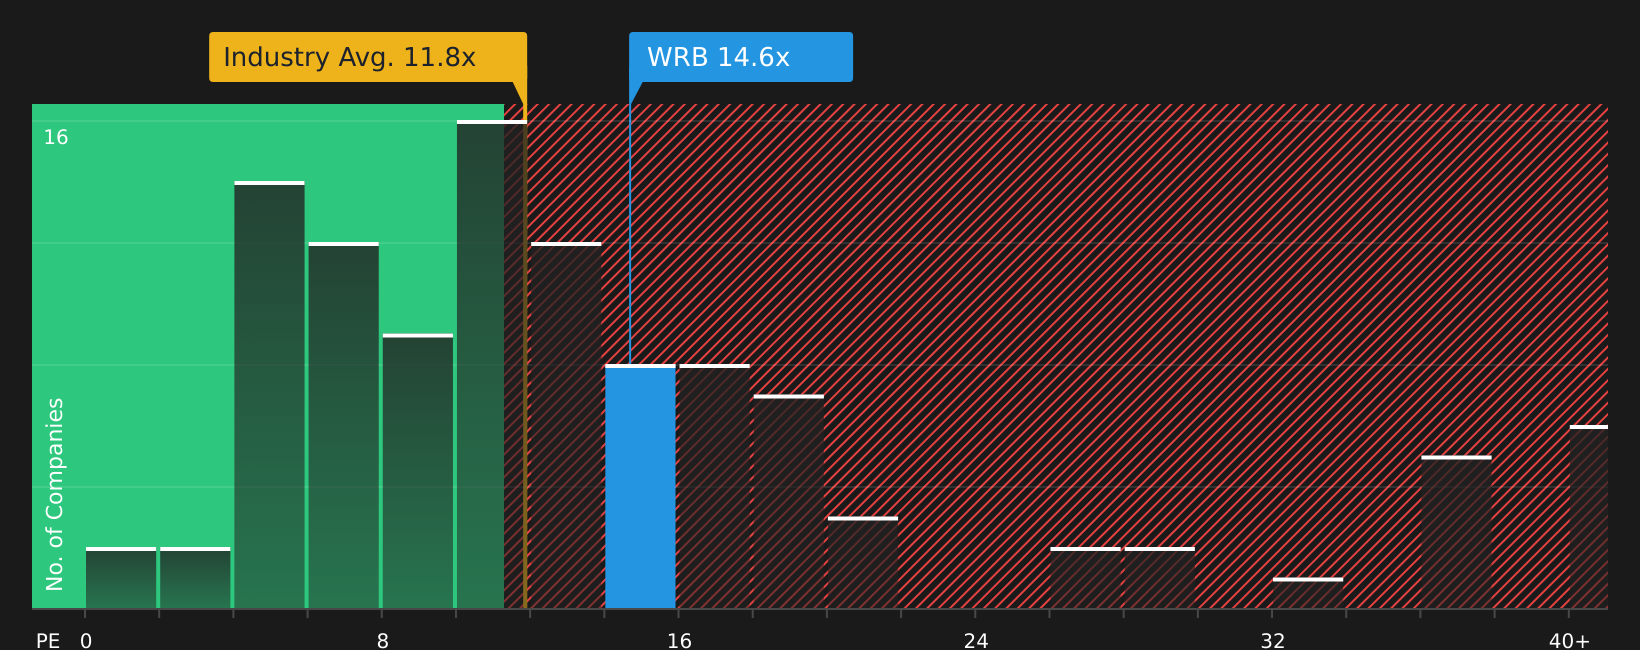
W. R. Berkley currently trades on a P/E of 14.74x. That sits above the Insurance industry average of 11.78x and the peer average of 11.96x, which suggests the stock carries a higher earnings multiple than many sector peers. Simply Wall St’s Fair Ratio for W. R. Berkley is 10.52x, which is a proprietary estimate of what a “normal” P/E might look like after accounting for factors such as earnings growth, profit margins, industry, market cap and company specific risks.
This Fair Ratio can be more informative than a basic peer or industry comparison because it adjusts for those company specific characteristics rather than assuming all insurers deserve the same multiple. Comparing 14.74x to the Fair Ratio of 10.52x implies W. R. Berkley is trading above that model based reference point.
Result: OVERVALUED
P/E ratios tell one story, but what if the real opportunity lies elsewhere? Start investing in legacies, not executives. Discover our 20 top founder-led companies.
Upgrade Your Decision Making: Choose your W. R. Berkley Narrative
Earlier it was mentioned that there is an even better way to think about valuation, so Narratives on Simply Wall St let you attach your own story about W. R. Berkley to the numbers by linking your view of its future revenue, earnings and margins to a financial forecast, a Fair Value, and then a simple comparison with the current share price. Each Narrative sits inside the Community page and updates automatically when new earnings or news arrive. For example, one investor might lean toward a higher Fair Value such as US$78.0 because they focus on underwriting discipline and capital returns. Another might anchor closer to a lower Fair Value such as US$51.0 because they are more cautious about competition, catastrophe risk and pricing. You can then choose which version fits your own view of the stock.
For W. R. Berkley, however, we will make it really easy for you with previews of two leading W. R. Berkley Narratives:
Fair value in this bullish narrative: US$78.00 per share
Implied discount to this fair value versus the recent US$71.01 share price: about 9.0% undervalued
Revenue trend used in the model: revenue is assumed to decline 96.9% a year
- Focuses on underwriting discipline in specialty and liability lines and heavier use of data driven risk management to support higher margins and resilient earnings.
- Assumes earnings, profit margins and book value benefit from embedded growth projects, new operations and a large, income generating investment portfolio.
- Flags key risks around catastrophe losses, competition from MGAs and reinsurers, interest rate shifts, reinsurance terms and persistent inflation on claims costs.
Fair value in this more cautious narrative: US$68.33 per share
Implied premium to this fair value versus the recent US$71.01 share price: about 3.9% overvalued
Revenue trend used in the model: revenue is assumed to decline 81.4% a year
- Highlights W. R. Berkley’s specialty focus, capital discipline and current margin profile, but frames expected returns as more in line with a softening pricing cycle.
- Builds its fair value on consensus assumptions for flat revenue, modest margin uplift and a future P/E that is slightly above the broader US insurance sector.
- Points to competitive pressure, inflation, catastrophe exposure, MGA quality risk, digital execution and geographic concentration as factors that could cap future upside.
If you want to move beyond previews, the next step is to decide which of these W. R. Berkley Narratives sits closer to your own assumptions about pricing, margins and risk, then adjust the inputs and build a version that matches your view of the stock.
To see how these results tie into long-term growth, risks, and valuation, check out the full range of community narratives for W. R. Berkley on Simply Wall St. Add the company to your watchlist or portfolio so you'll be alerted when the story evolves.
Do you think there's more to the story for W. R. Berkley? Head over to our Community to see what others are saying!

This article by Simply Wall St is general in nature. We provide commentary based on historical data and analyst forecasts only using an unbiased methodology and our articles are not intended to be financial advice. It does not constitute a recommendation to buy or sell any stock, and does not take account of your objectives, or your financial situation. We aim to bring you long-term focused analysis driven by fundamental data. Note that our analysis may not factor in the latest price-sensitive company announcements or qualitative material. Simply Wall St has no position in any stocks mentioned.