We Like Garrett Motion's (NASDAQ:GTX) Returns And Here's How They're Trending
Garrett Motion Inc. GTX | 18.41 | -1.02% |
To find a multi-bagger stock, what are the underlying trends we should look for in a business? Firstly, we'll want to see a proven return on capital employed (ROCE) that is increasing, and secondly, an expanding base of capital employed. Put simply, these types of businesses are compounding machines, meaning they are continually reinvesting their earnings at ever-higher rates of return. And in light of that, the trends we're seeing at Garrett Motion's (NASDAQ:GTX) look very promising so lets take a look.
Return On Capital Employed (ROCE): What Is It?
Just to clarify if you're unsure, ROCE is a metric for evaluating how much pre-tax income (in percentage terms) a company earns on the capital invested in its business. The formula for this calculation on Garrett Motion is:
Return on Capital Employed = Earnings Before Interest and Tax (EBIT) ÷ (Total Assets - Current Liabilities)
0.47 = US$509m ÷ (US$2.4b - US$1.4b) (Based on the trailing twelve months to September 2025).
So, Garrett Motion has an ROCE of 47%. In absolute terms that's a great return and it's even better than the Auto Components industry average of 11%.
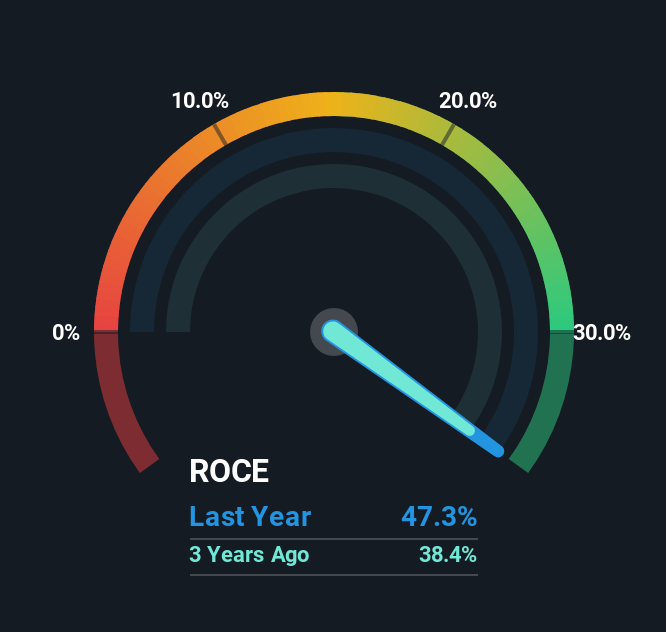
In the above chart we have measured Garrett Motion's prior ROCE against its prior performance, but the future is arguably more important. If you'd like, you can check out the forecasts from the analysts covering Garrett Motion for free.
What Can We Tell From Garrett Motion's ROCE Trend?
Garrett Motion's ROCE growth is quite impressive. More specifically, while the company has kept capital employed relatively flat over the last five years, the ROCE has climbed 65% in that same time. So it's likely that the business is now reaping the full benefits of its past investments, since the capital employed hasn't changed considerably. It's worth looking deeper into this though because while it's great that the business is more efficient, it might also mean that going forward the areas to invest internally for the organic growth are lacking.
On a separate but related note, it's important to know that Garrett Motion has a current liabilities to total assets ratio of 56%, which we'd consider pretty high. This effectively means that suppliers (or short-term creditors) are funding a large portion of the business, so just be aware that this can introduce some elements of risk. Ideally we'd like to see this reduce as that would mean fewer obligations bearing risks.
The Bottom Line
To bring it all together, Garrett Motion has done well to increase the returns it's generating from its capital employed. And a remarkable 199% total return over the last five years tells us that investors are expecting more good things to come in the future. With that being said, we still think the promising fundamentals mean the company deserves some further due diligence.
If you'd like to know more about Garrett Motion, we've spotted 2 warning signs, and 1 of them shouldn't be ignored.
If you'd like to see other companies earning high returns, check out our free list of companies earning high returns with solid balance sheets here.
This article by Simply Wall St is general in nature. We provide commentary based on historical data and analyst forecasts only using an unbiased methodology and our articles are not intended to be financial advice. It does not constitute a recommendation to buy or sell any stock, and does not take account of your objectives, or your financial situation. We aim to bring you long-term focused analysis driven by fundamental data. Note that our analysis may not factor in the latest price-sensitive company announcements or qualitative material. Simply Wall St has no position in any stocks mentioned.