Weighing Aptiv (APTV) After Mixed Returns And Conflicting Valuation Signals
Aptiv PLC APTV | 59.07 | -0.49% |
- If you are wondering whether Aptiv's current share price lines up with its underlying value, you are not alone. This article is designed to help you frame that question clearly.
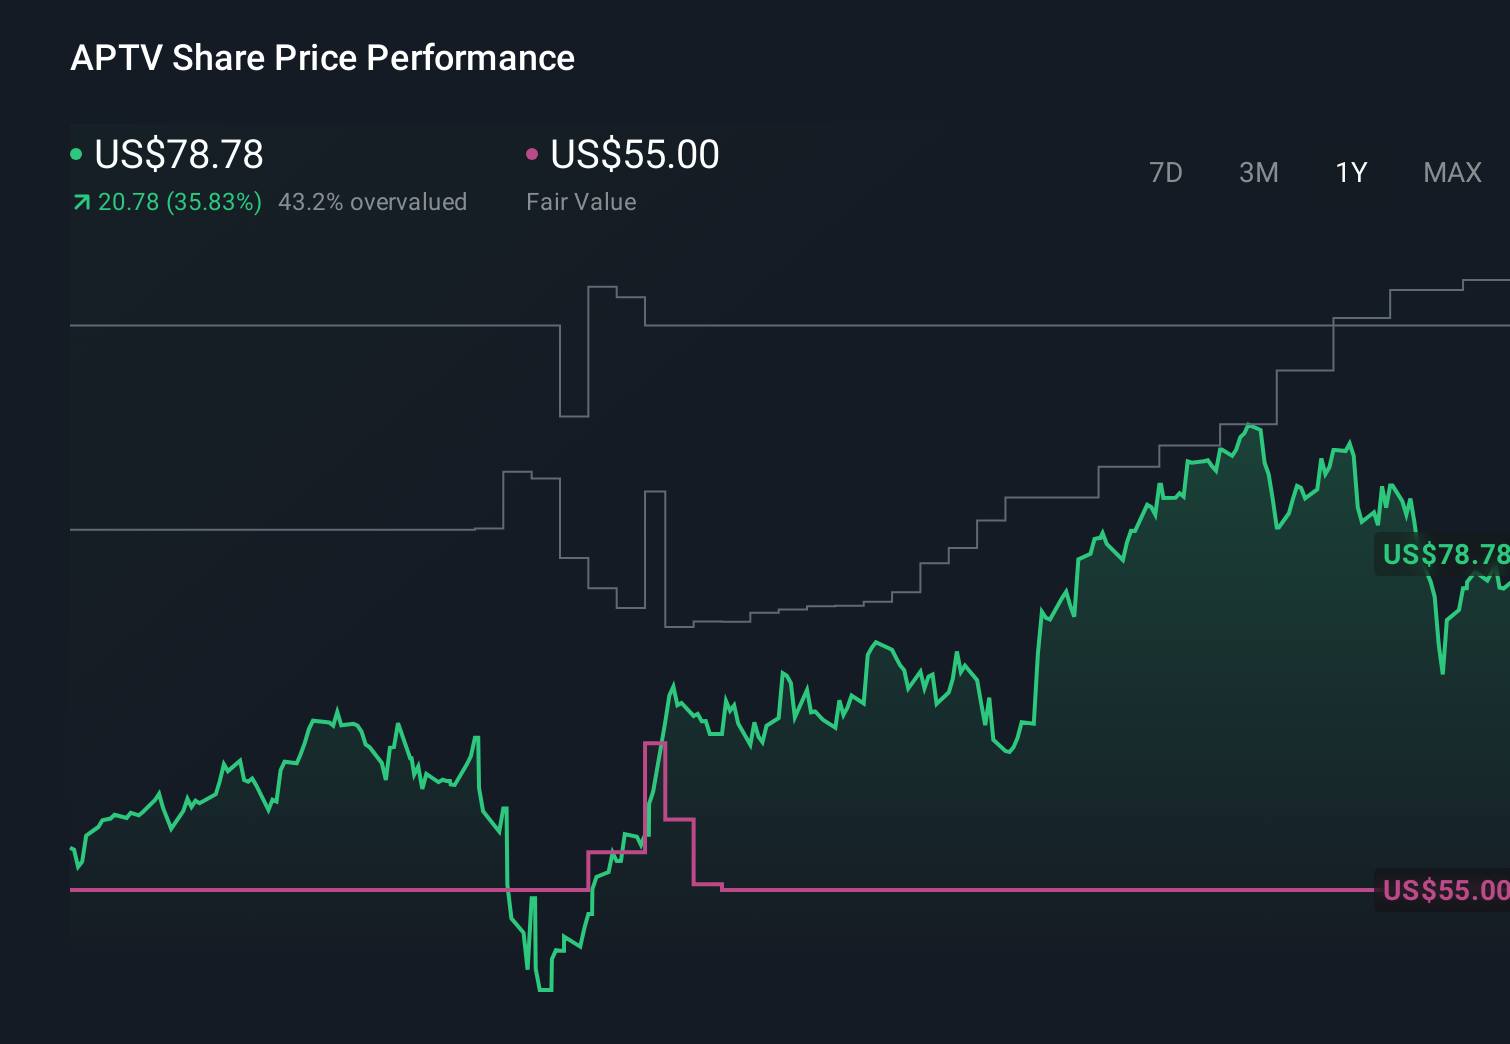
- Aptiv's stock last closed at US$79.72, with returns of 1.1% over 7 days, a 3.5% decline over 30 days, 1.6% year to date, a 25.6% gain over 1 year, and declines of 31.3% and 48.2% over 3 and 5 years respectively. Taken together, these figures give a mixed signal about growth potential and risk perception.
- Recent attention on Aptiv has focused on how its share price history lines up with investor expectations about the business and the wider auto components sector. That context helps explain why some investors are reassessing whether the current price still offers a reasonable entry point or calls for more caution.
- Simply Wall St's valuation framework currently gives Aptiv a value score of 3 out of 6. Next we will walk through the key valuation approaches behind that score, and then finish with a way to pull those numbers together into a clearer big picture.
Approach 1: Aptiv Discounted Cash Flow (DCF) Analysis
A Discounted Cash Flow, or DCF, model estimates what a company might be worth today by projecting its future cash flows and discounting them back to a single present value figure.
For Aptiv, the latest twelve months Free Cash Flow is about $1.37b. Simply Wall St applies a 2 Stage Free Cash Flow to Equity model that uses analyst forecasts where available, then extends those cash flows further into the future using its own assumptions. Within that framework, Aptiv's projected Free Cash Flow for 2028 is $1.74b, and the model continues with additional projections out to 2035, all converted into today's dollars.
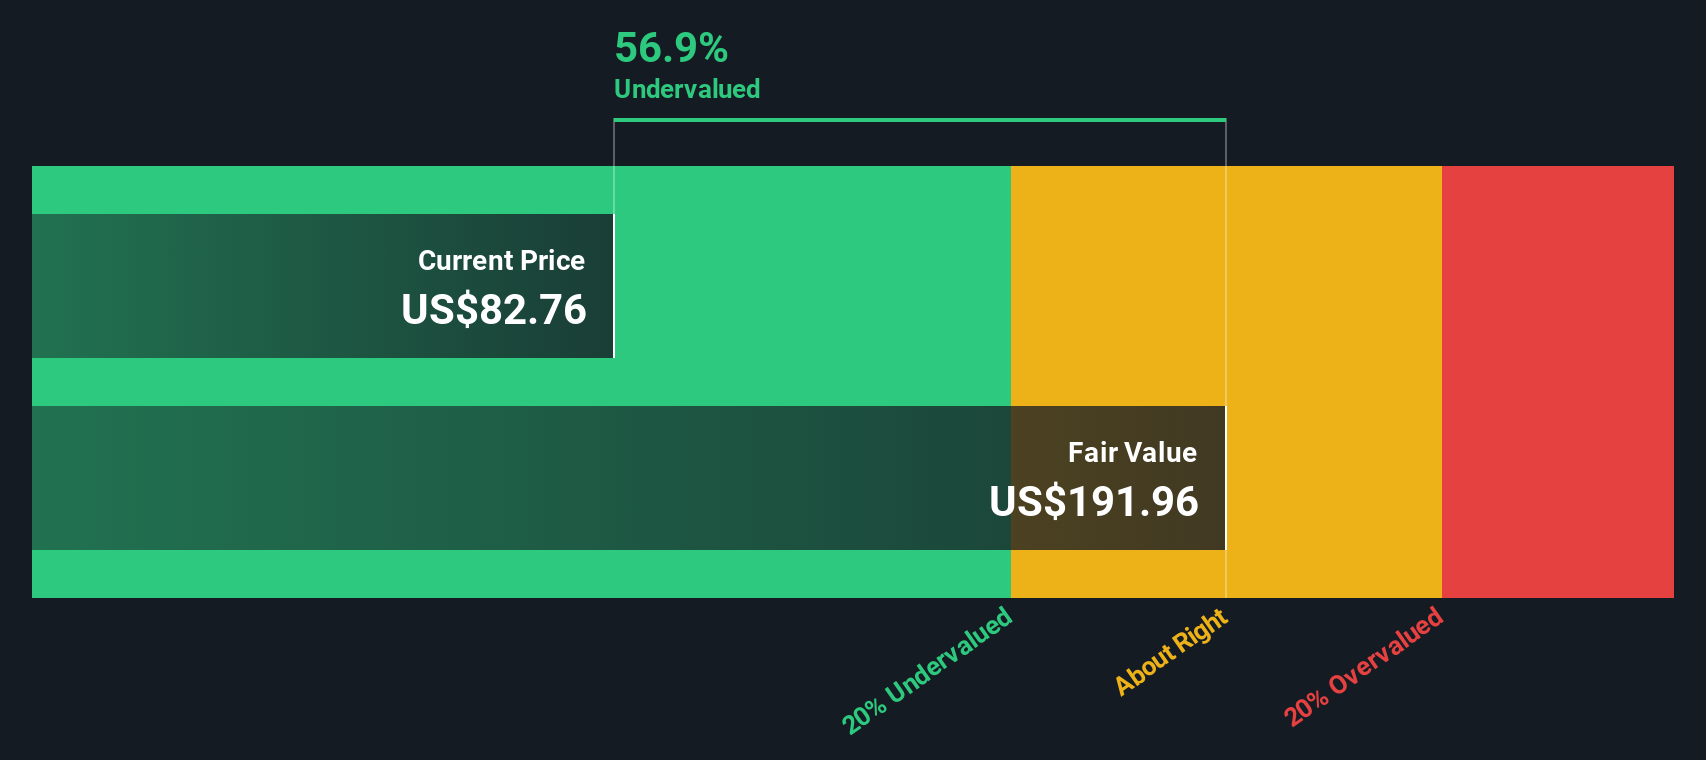
On this basis, the DCF model points to an estimated intrinsic value of about $129.91 per share. Against the recent share price of $79.72, this implies the stock is 38.6% undervalued according to these cash flow assumptions.
Result: UNDERVALUED
Our Discounted Cash Flow (DCF) analysis suggests Aptiv is undervalued by 38.6%. Track this in your watchlist or portfolio, or discover 55 more high quality undervalued stocks.
Approach 2: Aptiv Price vs Earnings
For a profitable company like Aptiv, the P/E ratio is a useful way to see how much you are paying for each dollar of earnings. It connects directly to what the business is currently earning, which many investors find easier to relate to than cash flow models.
What counts as a "normal" or "fair" P/E depends on how the market views a company’s earnings growth prospects and risks. Higher growth or lower perceived risk can support a higher P/E, while slower growth or higher risk usually calls for a lower one.
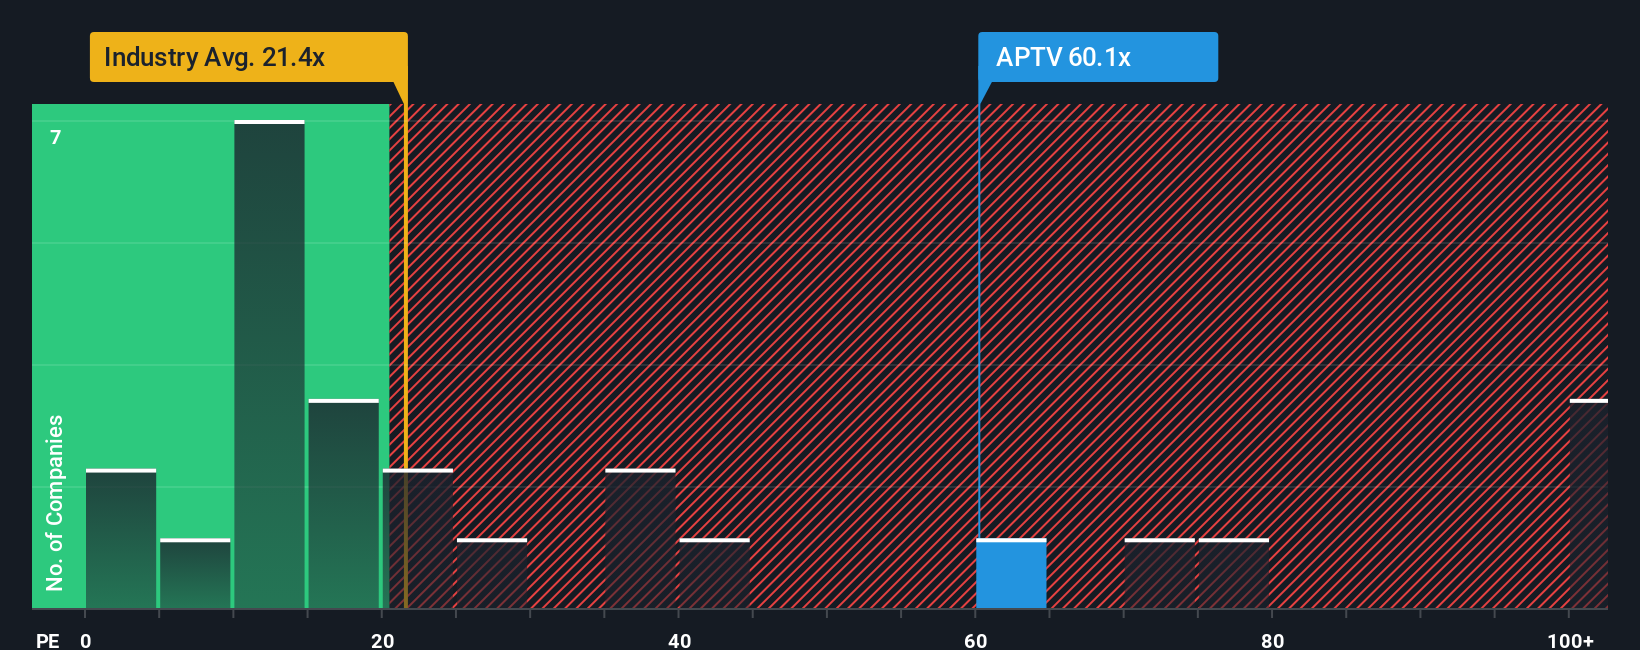
Aptiv currently trades on a P/E of 104.40x. That is well above the Auto Components industry average of 24.30x and also above the broader peer group average of 28.61x. Simply Wall St’s Fair Ratio for Aptiv is 33.62x, which is its proprietary estimate of what a justified P/E might look like after accounting for factors such as earnings growth, profitability, risk profile, industry and market cap. This tailored Fair Ratio aims to be more informative than a simple comparison with peers or the industry alone, because it reflects Aptiv’s specific characteristics.
Comparing the Fair Ratio of 33.62x with the current P/E of 104.40x suggests Aptiv is trading above that fair range on an earnings basis.
Result: OVERVALUED
P/E ratios tell one story, but what if the real opportunity lies elsewhere? Start investing in legacies, not executives. Discover our 22 top founder-led companies.
Upgrade Your Decision Making: Choose your Aptiv Narrative
Earlier we mentioned that there is an even better way to understand valuation, so let us introduce you to Narratives, which are simply your story about a company linked directly to the numbers you think are realistic for its future.
With a Narrative, you spell out how you see Aptiv’s business, then connect that view to your own estimates for future revenue, earnings and margins. These estimates in turn flow through to a fair value that you can compare with today’s share price.
Narratives on Simply Wall St, available to millions of investors on the Community page, are designed to be easy to use. This means you can quickly see whether your fair value suggests Aptiv is priced attractively or whether it looks expensive for your expectations.
Because Narratives are updated automatically when new information such as earnings releases or major news arrives, your forecast and fair value stay in sync with what is happening. You can also see at a glance how different investors might set very different fair values for Aptiv while looking at the same data.
Do you think there's more to the story for Aptiv? Head over to our Community to see what others are saying!
This article by Simply Wall St is general in nature. We provide commentary based on historical data and analyst forecasts only using an unbiased methodology and our articles are not intended to be financial advice. It does not constitute a recommendation to buy or sell any stock, and does not take account of your objectives, or your financial situation. We aim to bring you long-term focused analysis driven by fundamental data. Note that our analysis may not factor in the latest price-sensitive company announcements or qualitative material. Simply Wall St has no position in any stocks mentioned.