

Weighing Rivian (RIVN) After Recent Volatility And Long Term EV Ambitions
Rivian Automotive RIVN | 0.00 |
- If you are wondering whether Rivian Automotive's share price still offers value at current levels, the key is to understand what fundamentals and expectations are already baked into the stock.
- Rivian's stock has been volatile recently, with a 14.8% gain over the last 7 days, a 1.7% return over the past month, a year to date performance that is down 15.9%, and a 12.4% return over the last year.
- Recent attention has focused on Rivian's position as an electric vehicle producer, including its product rollout and partnerships, which continue to shape how investors think about the company's long term potential. Broader sector sentiment around electric vehicles, capital needs and competition has also framed how the market reacts to updates from Rivian.
- On Simply Wall St's 6 point valuation checklist, Rivian scores 2 out of 6. This raises the question of how different valuation approaches judge the stock today and hints at a more complete way to think about value that will be discussed at the end of this article.
Rivian Automotive scores just 2/6 on our valuation checks. See what other red flags we found in the full valuation breakdown.
Approach 1: Rivian Automotive Discounted Cash Flow (DCF) Analysis
A Discounted Cash Flow model projects a company’s future cash flows and then discounts them back to today’s value to estimate what the stock might be worth right now.
For Rivian, the latest twelve months Free Cash Flow is a loss of $2.71b. Analysts and model estimates suggest Free Cash Flow remains under pressure in the next few years, with projected annual figures that include a loss of $4.14b in 2026 and a loss of $3.16b in 2027, before moving into positive territory. By 2030, projected Free Cash Flow is $1.54b, and the model then extrapolates further growth out to 2035 using a 2 Stage Free Cash Flow to Equity approach.
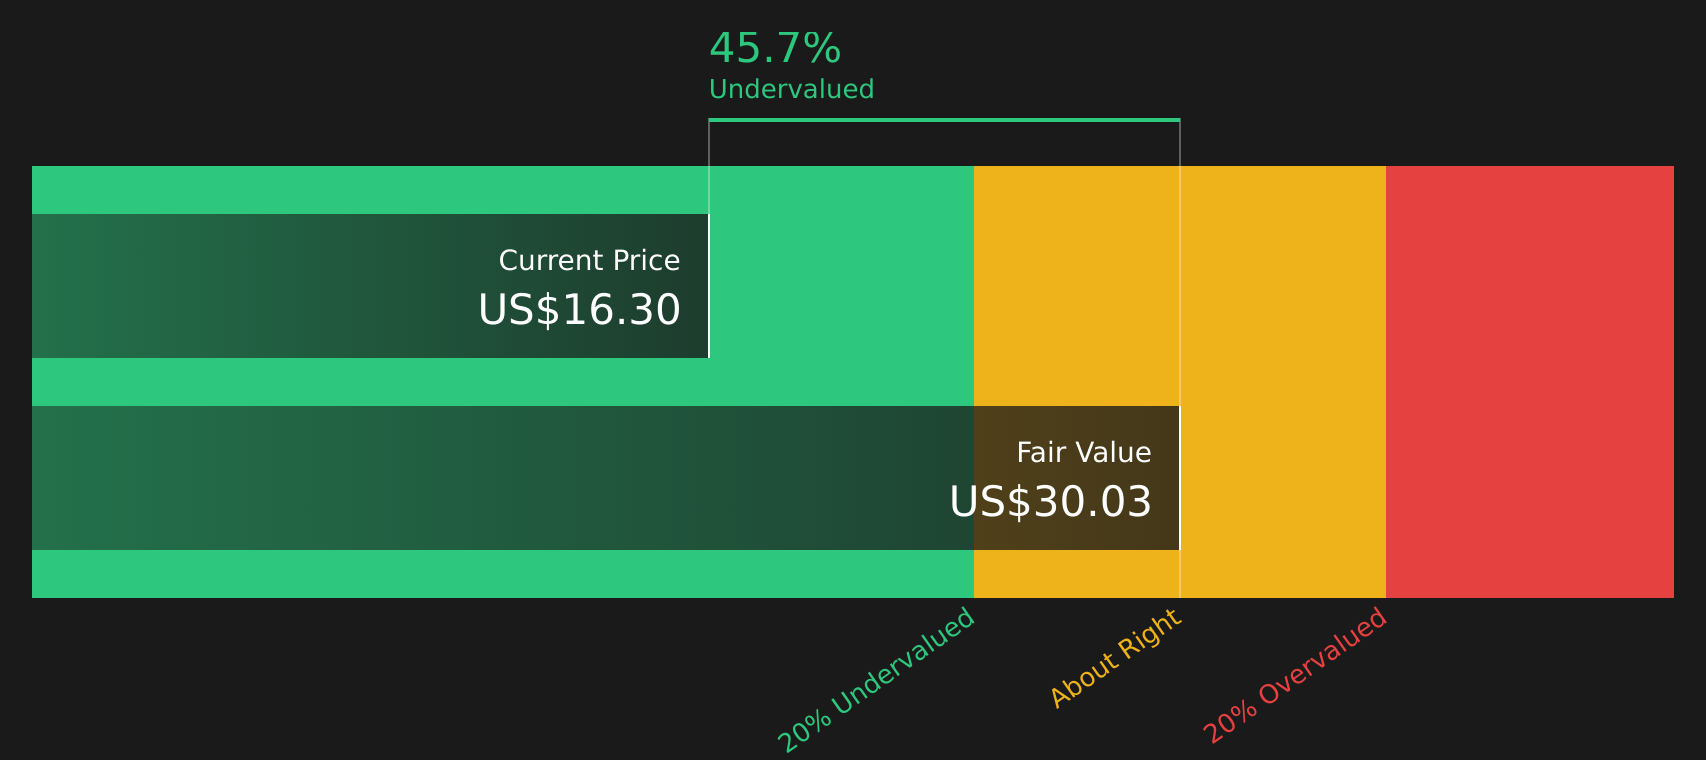
Using these cash flow projections, Simply Wall St’s DCF output indicates an estimated intrinsic value of $29.50 per share. Compared with the current share price, this implies the stock trades at a 44.7% discount, which in this model suggests Rivian is undervalued.
Result: UNDERVALUED
Our Discounted Cash Flow (DCF) analysis suggests Rivian Automotive is undervalued by 44.7%. Track this in your watchlist or portfolio, or discover 46 more high quality undervalued stocks.
Approach 2: Rivian Automotive Price vs Sales
For companies that are still building toward consistent profitability, P/S is often more useful than P/E because it compares what investors pay for each dollar of revenue rather than each dollar of earnings. It still reflects growth expectations and risk, since higher growth or lower perceived risk can justify a higher P/S multiple, while slower growth or higher risk usually argues for a lower one.
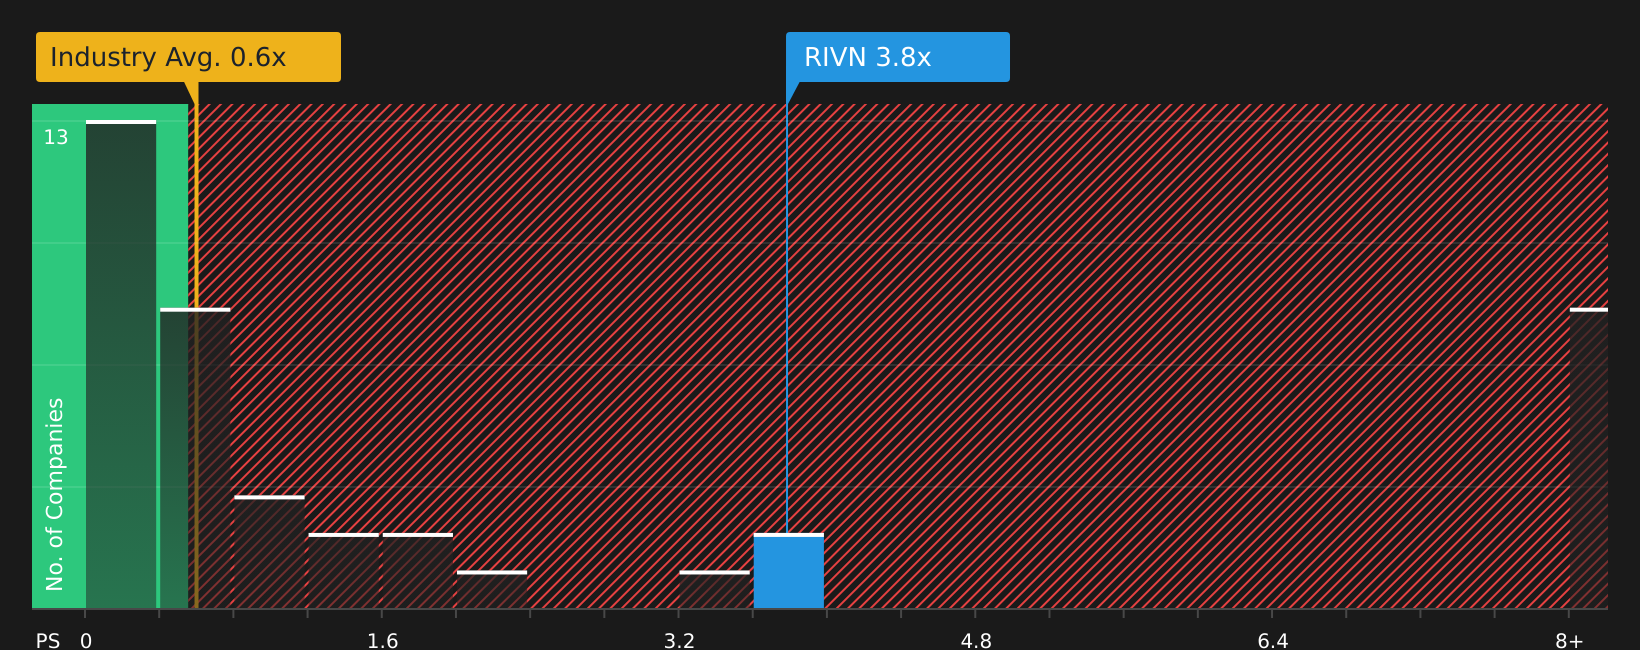
Rivian currently trades on a P/S ratio of 3.78x. This sits above the Auto industry average P/S of 0.60x and also above the peer average of 0.92x, so the stock is priced at a higher multiple of sales than many comparable companies. Simply Wall St’s Fair Ratio for Rivian is 1.80x. This is a proprietary estimate of what P/S might be reasonable given factors such as the company’s earnings profile, industry, profit margins, market cap and identified risks.
The Fair Ratio can be more informative than a simple comparison with peers or the industry because it adjusts for Rivian’s specific characteristics rather than relying on broad group averages. With the current P/S of 3.78x sitting above the Fair Ratio of 1.80x, the stock screens as expensive on this metric.
Result: OVERVALUED
P/S ratios tell one story, but what if the real opportunity lies elsewhere? Start investing in legacies, not executives. Discover our 20 top founder-led companies.
Upgrade Your Decision Making: Choose your Rivian Automotive Narrative
Earlier it was mentioned that there is an even better way to understand valuation. Simply Wall St’s Narratives take the story you believe about Rivian Automotive, link it to a full forecast for revenue, earnings and margins, then translate that into a Fair Value you can compare with today’s share price. All of this is available within an easy tool on the Community page that millions of investors use. Each Narrative automatically refreshes as new news or earnings arrive. This is why one investor might build a bullish Rivian view with a Fair Value of about US$25 based on higher expected growth and margins, while another might build a more cautious view with a Fair Value closer to about US$9.40 using lower growth and profitability assumptions.
For Rivian Automotive, however, we will make it really easy for you with previews of two leading Rivian Automotive Narratives:
Fair value in this bullish narrative: US$16.96 per share
Gap to this fair value versus the last close of US$16.33: about 3.7% below the narrative fair value
Annual revenue growth assumption: 40.76%
- Focuses on the R2 platform, cost efficiencies and manufacturing scale as key drivers that could improve margins and support a larger revenue base over time.
- Highlights vertical integration in autonomy, batteries and software, plus partnerships such as Volkswagen and Amazon, as potential sources of higher margin and more diversified revenue.
- Anchors fair value around analyst consensus assumptions for revenue, margin improvement and a future P/E multiple, while stressing that investors should test these inputs against their own expectations.
Fair value in this bearish narrative: US$9.42 per share
Gap to this fair value versus the last close of US$16.33: about 73.3% above the narrative fair value
Annual revenue growth assumption: 33.85%
- Emphasises weaker policy support for EVs, higher tariffs and cost inflation as pressures on unit demand, margins and the ability to justify heavy investment plans.
- Flags ongoing cash burn, underused production capacity and potential funding needs as key risks that could weigh on earnings per share and shareholder dilution.
- Builds a fair value using lower growth and margin assumptions and a high required future P/E, reflecting concerns that current market expectations may be too optimistic even if the business improves.
Your job now is to decide which set of assumptions feels closer to how you see Rivian's future, or to build something in between using the full range of Narratives on the Community page.
To see how these results tie into long-term growth, risks, and valuation, check out the full range of community narratives for Rivian Automotive on Simply Wall St. Add the company to your watchlist or portfolio so you'll be alerted when the story evolves.
Do you think there's more to the story for Rivian Automotive? Head over to our Community to see what others are saying!

This article by Simply Wall St is general in nature. We provide commentary based on historical data and analyst forecasts only using an unbiased methodology and our articles are not intended to be financial advice. It does not constitute a recommendation to buy or sell any stock, and does not take account of your objectives, or your financial situation. We aim to bring you long-term focused analysis driven by fundamental data. Note that our analysis may not factor in the latest price-sensitive company announcements or qualitative material. Simply Wall St has no position in any stocks mentioned.