

Wells Fargo Stock And 2 Large Cap Value Picks For Higher Rates
Wells Fargo & Company WFC | 0.00 |
With the Federal Reserve signaling a fresh tightening cycle, CPI inflation at 4.1% in May 2026, and oil markets unsettled by conflict in the Persian Gulf, many investors are reassessing where large cap value stocks might fit in their portfolios. This article looks at three U.S. Large-Cap Value Stocks that were screened for low valuation metrics and relatively steady trading, and examines how their exposure to these macro shifts could matter. You will see how rising rates, inflation pressures, and volatile energy costs might create potential opportunities or added risks for each stock.
Wells Fargo (WFC)
Overview: Wells Fargo is a large U.S. financial services company that offers everyday banking, lending, investment, and wealth management services to consumers, businesses, and institutions across several business lines. It earns money from products such as checking and savings accounts, credit cards, mortgages, corporate loans, and capital markets services.
Operations: Wells Fargo generates most of its revenue from Consumer Banking and Lending at about US$34.5b, followed by Corporate and Investment Banking at about US$19.2b, Wealth and Investment Management at about US$16.8b, and Commercial Banking at about US$11.9b, with the vast majority earned in the United States at about US$81.1b.
Market Cap: US$266.7b
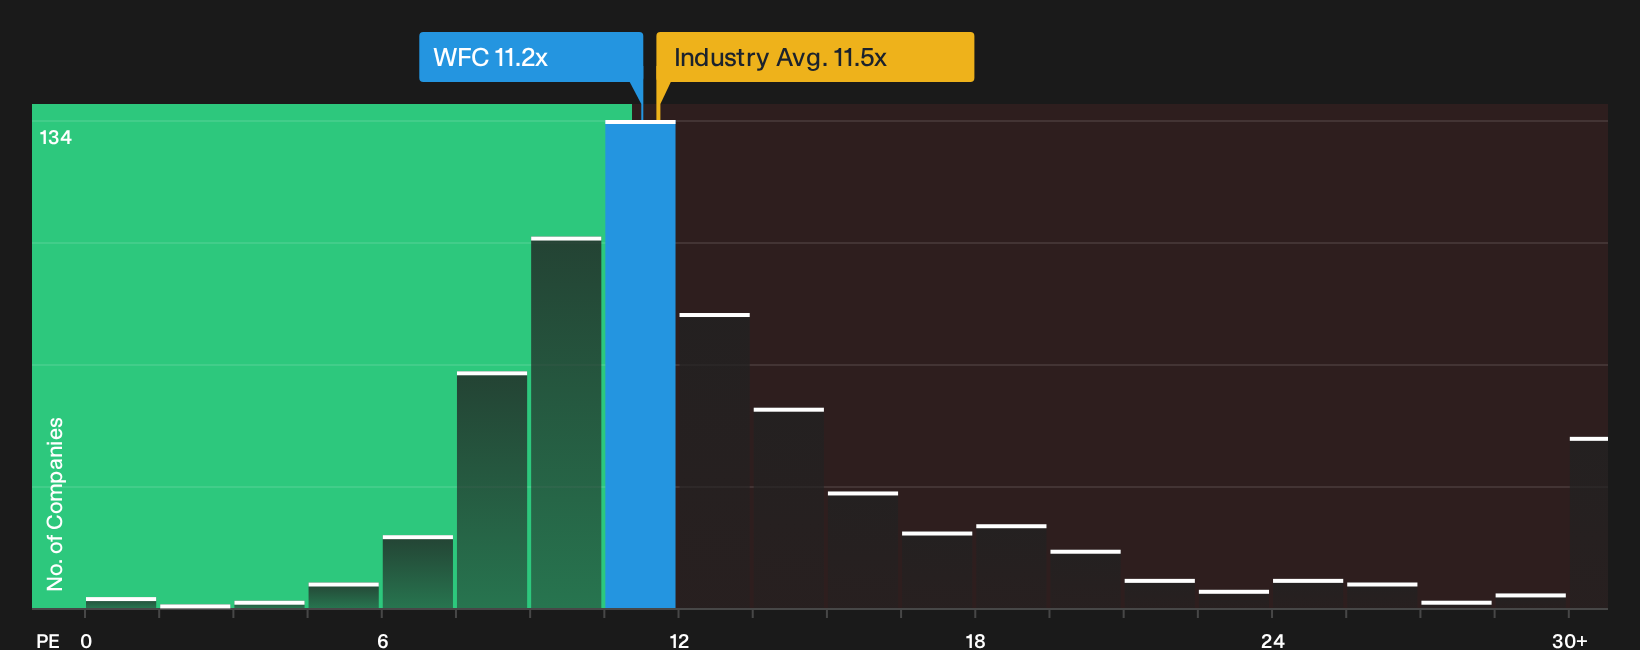
Investors looking at Wells Fargo today are getting a large U.S. bank that still trades on value metrics while sitting at the heart of the rising rate story, with higher net interest income potentially supported by a tightening Federal Reserve and volatile inflation. The company recently beat Q2 2026 expectations, raised its dividend and ramped up buybacks, which signals confidence in its balance sheet and capital strength. However, earnings growth is modest and return on equity of 12.1% is not high for a major bank. Add in an unstable dividend track record and ongoing regulatory and competitive pressures, and Wells Fargo is not a straightforward call, but the mix of low P/E, improving margins and interest rate sensitivity gives investors plenty to think about.
Wells Fargo’s combination of a low P/E, rising net interest income potential, and fresh capital returns appears to be a story investors are only half pricing in, yet the real twist sits in the 3 key rewards and 1 important warning sign
PNC Financial Services Group (PNC)
Overview: PNC Financial Services Group is a large U.S. bank that combines everyday retail banking with corporate lending, payments, and wealth management, serving consumers, small businesses, big companies, and institutions through branches, digital channels, and dedicated relationship teams.
Operations: PNC generates most of its revenue from Retail Banking including residential mortgage at about US$14.8b and Corporate & Institutional Banking at about US$11.3b, with additional contributions from Asset Management Group at about US$1.8b. These are partially offset by other items that reduce reported revenue by about US$4.8b.
Market Cap: US$101.2b
PNC Financial Services Group offers a diversified, higher rate sensitive bank profile with a mix of steady earnings, a 2.69% dividend and a net profit margin of 29.7%. Some investors view it as a potential beneficiary of a renewed Fed tightening cycle. Recent analyst commentary highlights expectations for moderate earnings and revenue growth. In addition, the planned 18% dividend increase to US$2.00 per share and the FirstBank integration in Colorado and Arizona indicate confidence in capital strength and branch led expansion. At the same time, insider selling, a P/E above the broader U.S. banks average and questions over how much more return on equity can improve all help define the risk side of the ledger. This is also where the large discount to estimated fair value and the medium term rate story become particularly relevant for many investors.
PNC’s mix of a 2.69% dividend, 29.7% net profit margin and branch led expansion hints at a richer story that many investors may be glossing over, and the real tension between its rate sensitivity, valuation and capital plans sits inside the 4 key rewards and 1 important warning sign

ConocoPhillips (COP)
Overview: ConocoPhillips is a large U.S. oil and gas producer that explores for, extracts, transports, and sells crude oil, natural gas, LNG, and related liquids across North America and key energy regions in Europe, the Middle East, and Asia Pacific.
Operations: ConocoPhillips generates most of its revenue in the Lower 48 at about US$40.9b, with additional contributions from Europe, Middle East and North Africa at about US$6.7b, Canada at about US$5.7b, Alaska at about US$5.6b, Asia Pacific at about US$2.6b, and smaller corporate and intersegment items.
Market Cap: US$132.8b
ConocoPhillips stands out in this large cap value screen because it sits at the center of two themes investors are focused on: volatile crude prices linked to the Middle East conflict and the Federal Reserve’s renewed tightening path. The company combines a large, diversified portfolio of oil and LNG assets with free cash flow generation and a history of returning cash to shareholders. Its unhedged exposure to oil prices means the stock can respond strongly when supply disruptions and inflation keep energy prices elevated. At the same time, earnings recently came under pressure, margins have compressed, and the portfolio is heavily tied to large, capital intensive projects and traditional hydrocarbons. This leaves ConocoPhillips exposed if oil prices soften or decarbonization policies tighten faster than expected.
ConocoPhillips sits where unhedged oil exposure, free cash flow and shareholder returns intersect. The real story is how that exposure could evolve under different price paths, which is unpacked in the analysis report for ConocoPhillips

The three stocks covered here are just a starting point, and the full U.S. Large-Cap Value Stocks screen has surfaced 15 more companies in the U.S. Large-Cap Value Stocks screener that share similarly compelling value traits and narratives. Use Simply Wall St to identify, filter, and analyze the specific catalysts, balance sheet strength, and dividend profiles that matter most to you so you can focus on the highest conviction ideas in this group.
Take Control of Your Investment Journey
If ConocoPhillips or any of these companies sound like a great opportunity, register for FREE with Simply Wall St and add your companies to a Watchlist to monitor the share price against the fair value the ideal entry point. Once you've made your move, manage your holdings with our Portfolio Command Center that filters out the noise to deliver only the most critical, actionable updates. Throughout your journey, our Community allows you to filter the best ideas from thousands of investor perspectives. By uncovering hidden catalysts and risks early, you'll accelerate your decision-making and stay one step ahead of the market.
Seeking Alternatives Beyond These Value Picks?
Fresh stock ideas do not stay under the radar for long, and momentum can build once a breakout is caught by the crowd, so move while it matters and get in early.
- Spot income workhorses with resilient cash flows and robust payouts by scanning the 8 dividend fortresses before yields change and prices move away from your ideal entry zone.
- Track under the radar growth stories quietly building momentum across AI infrastructure, and use the 52 AI infrastructure stocks to find companies before their stories are fully reflected in current prices.
- Explore future facing materials demand by checking the 31 best rare earth metal stocks that could be positioned to respond if supply tightens and prices adjust while most investors are still looking elsewhere.
This article by Simply Wall St is general in nature. We provide commentary based on historical data and analyst forecasts only using an unbiased methodology and our articles are not intended to be financial advice. It does not constitute a recommendation to buy or sell any stock, and does not take account of your objectives, or your financial situation. We aim to bring you long-term focused analysis driven by fundamental data. Note that our analysis may not factor in the latest price-sensitive company announcements or qualitative material. Simply Wall St has no position in any stocks mentioned.