Wells Fargo (WFC) Margin Improvement Tests Bullish Narratives After FY 2025 Earnings
Wells Fargo & Company WFC | 80.60 | +0.04% |
Wells Fargo (WFC) just wrapped up FY 2025 with Q4 revenue of US$20.3b and basic EPS of US$1.64, anchored by quarterly net income of US$5.1b. Over the past few quarters, the bank has seen revenue move from US$19.3b in Q4 2024 to US$19.2b in Q1 2025, US$19.8b in Q2, US$20.8b in Q3 and US$20.3b in Q4. EPS tracked from US$1.45 to US$1.41, US$1.61, US$1.68 and US$1.64 over the same stretch. This sets up a year where margins and profitability sit squarely in focus for investors.
See our full analysis for Wells Fargo.With the headline numbers on the table, the next step is to see how this earnings run squares with the widely held stories about Wells Fargo, highlighting where the data backs the narratives and where it pushes back.
Margins Hold As Costs Stay In Check
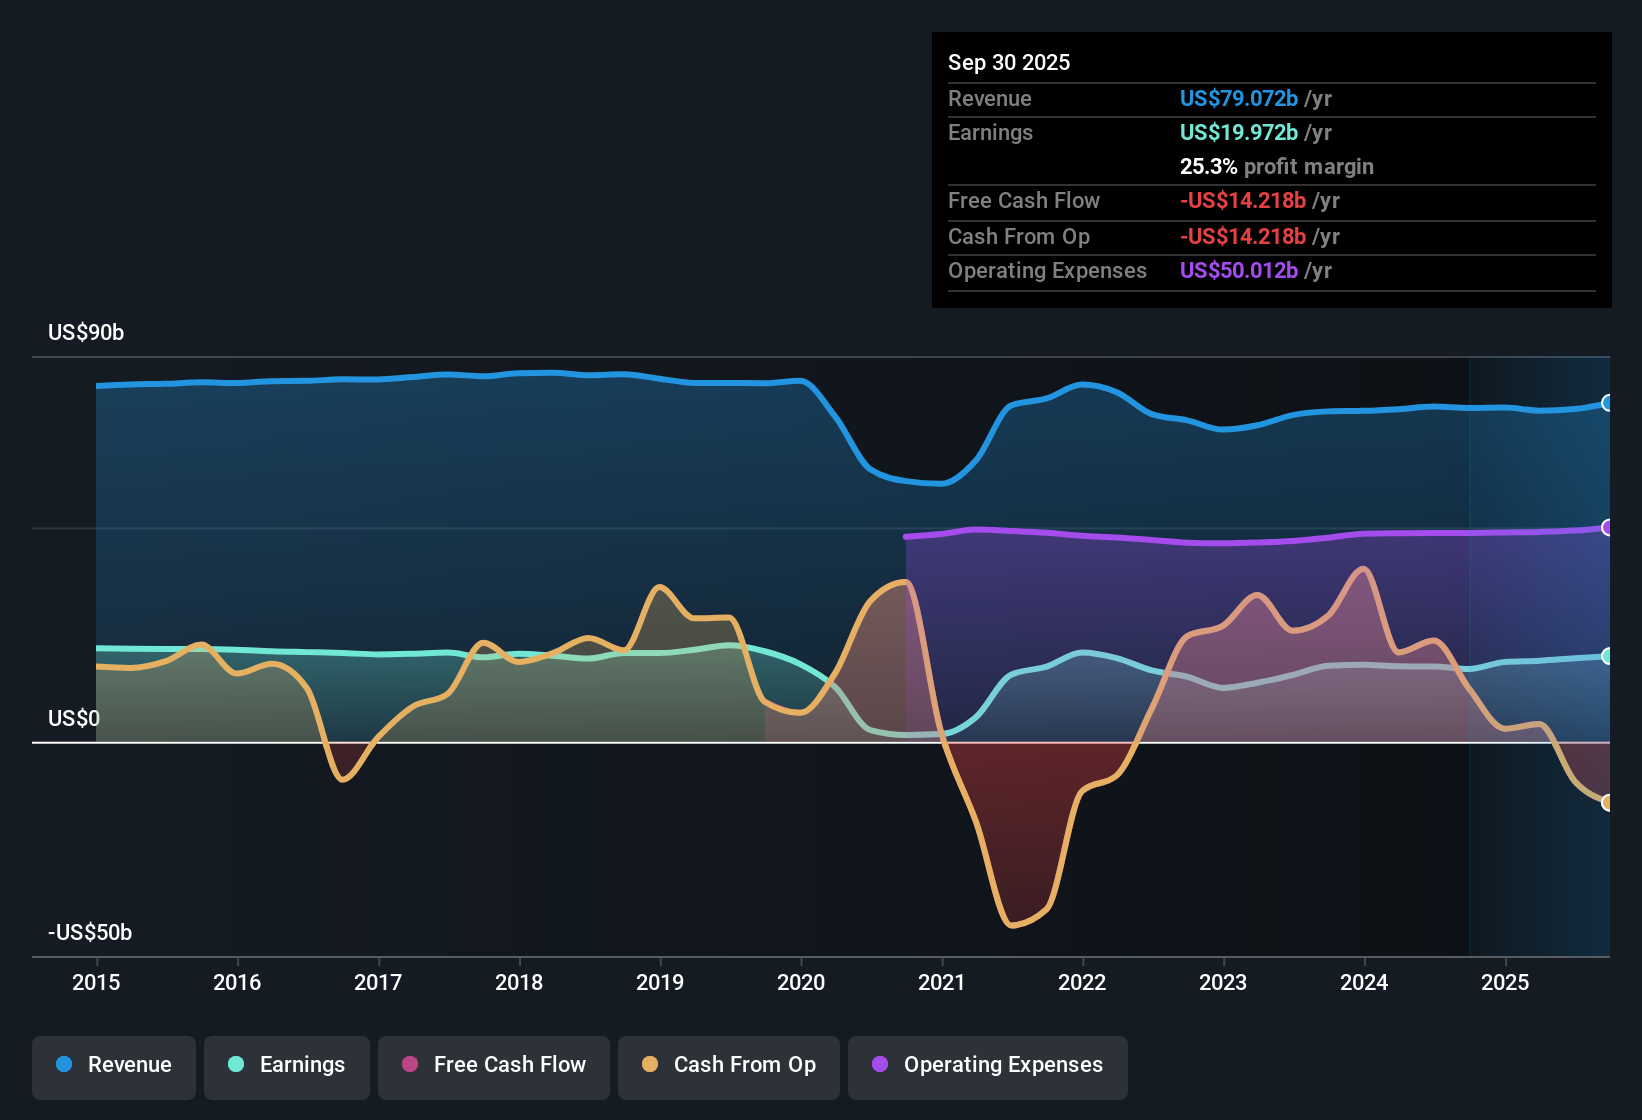
- Across FY 2025, Wells Fargo’s reported net profit margin over the last 12 months was 25.3%, compared with 23.9% in the prior year, while quarterly cost to income ratios ranged between 64% and 69%.
- Analysts' consensus view links higher digital usage and tech investment to better efficiency, and the margin data partly lines up with that, but with some tension:
- The 25.3% margin and trailing 12 month net income of about US$20.3b sit alongside cost to income ratios of 64% to 69%. This suggests efficiency is improving at the margin but not transforming the cost base yet.
- Consensus commentary points to scalable digital growth and expense discipline. However, FY 2025 quarterly cost ratios still cluster in the mid to high 60s, which shows operating leverage is developing gradually rather than sharply.
Loan Book Grows With Credit Quality Stable
- Total loans moved from US$909.7b in Q3 2024 to US$943.1b in Q3 2025, while non performing loans were between US$7.6b and US$8.2b across the same stretch, indicating a larger book with a similar absolute level of problem loans.
- Supporters of the bullish view, who focus on balance sheet growth after regulatory constraints eased, get some backing from these figures but also a few checks:
- Bulls point to renewed capacity to grow deposits and loans, and the rise in total loans of roughly US$33.4b from Q3 2024 to Q3 2025 fits that story of a bigger earning asset base.
- At the same time, non performing loans stayed in a relatively tight band around US$7.6b to US$8.0b. This does not signal a clear deterioration in credit quality alongside that growth based on the figures given.
Mixed Valuation Signals Around Growth
- The current share price of US$89.25 sits below both a P/E-based peer group where WFC trades on 13.8x versus 11.9x for the US banks industry, and a provided DCF fair value of about US$123.52, while analyst targets in the data point to US$100.68.
- Critics who lean more bearish focus on slower growth and valuation tension, and the numbers give them several concrete hooks:
- Earnings grew 9% over the last year versus a 5 year average of 11.3% per year, and forecasts call for roughly 5.3% annual earnings growth, which is below the 16.2% figure cited for the broader US market.
- On top of that, the trailing P/E of 13.8x sits above both the 11.9x industry average and the 13.5x peer average, while the dividend track record is described as unstable. Together, these points provide reasons for some investors to question how much of the slower growth profile is already reflected in the current price.
Next Steps
To see how these results tie into long-term growth, risks, and valuation, check out the full range of community narratives for Wells Fargo on Simply Wall St. Add the company to your watchlist or portfolio so you'll be alerted when the story evolves.
See the numbers differently? Take a fresh look at the figures, shape your own view in a few minutes, and turn it into a clear narrative with Do it your way
A great starting point for your Wells Fargo research is our analysis highlighting 3 key rewards and 1 important warning sign that could impact your investment decision.
See What Else Is Out There
Wells Fargo’s slower earnings growth compared with its 5 year average, softer growth forecasts, and above industry P/E leave some investors questioning the value on offer.
If that mix of softer growth and richer pricing bothers you, shift your focus to these 884 undervalued stocks based on cash flows today to zero in on ideas that may offer more compelling value.
This article by Simply Wall St is general in nature. We provide commentary based on historical data and analyst forecasts only using an unbiased methodology and our articles are not intended to be financial advice. It does not constitute a recommendation to buy or sell any stock, and does not take account of your objectives, or your financial situation. We aim to bring you long-term focused analysis driven by fundamental data. Note that our analysis may not factor in the latest price-sensitive company announcements or qualitative material. Simply Wall St has no position in any stocks mentioned.