Wells Fargo (WFC) Stock After Regulatory Scrutiny And Mixed Recent Returns
Wells Fargo & Company WFC | 0.00 |
- If you are wondering whether Wells Fargo stock still offers value at current levels, this article will walk through what the numbers are really saying about its price.
- After closing at US$83.51, the stock is slightly down 0.4% over the last week, up 7.7% over the past month and up 6.5% over the past year. However, the year to date return is down 12.3%, with a very large 107.4% return over three years and 109.0% over five years providing important context.
- Recent coverage around Wells Fargo has focused on ongoing regulatory scrutiny, cost controls and the broader outlook for large US banks. These factors continue to shape investor expectations. Together they help frame how the market is reacting to the stock's performance and why sentiment can shift quickly even when the latest quarter is not in focus.
- Simply Wall St currently gives Wells Fargo a valuation score of 4 out of 6. The rest of this article will break down what that means through different valuation methods, before finishing with a way to look beyond the models to understand the stock's value in a fuller context.
Approach 1: Wells Fargo Excess Returns Analysis
The Excess Returns model for Wells Fargo looks at how efficiently the company turns shareholder equity into profits, then compares those profits with the return investors typically expect for holding the stock. The idea is simple: if Wells Fargo earns more on its equity than its cost of equity, it generates excess returns that can justify a higher intrinsic value.
For Wells Fargo, the model uses a Book Value of $53.21 per share and a Stable EPS of $7.99 per share, based on weighted future Return on Equity estimates from 17 analysts. The Average Return on Equity is 13.35%, while the Cost of Equity is $4.80 per share, which implies an Excess Return of $3.20 per share. The Stable Book Value is projected at $59.86 per share, using estimates from 14 analysts.
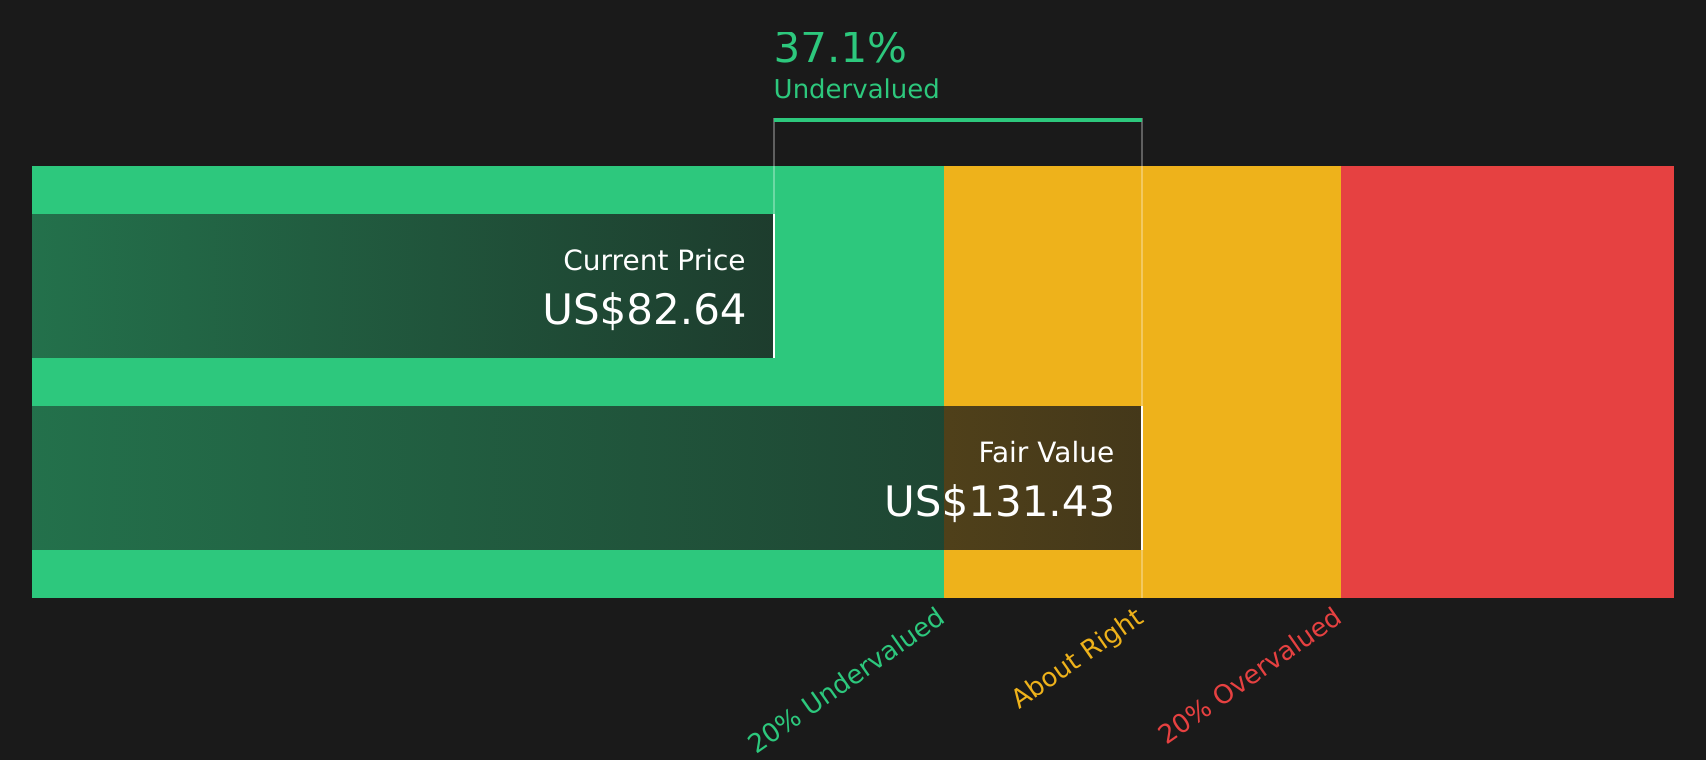
Combining these inputs, the Excess Returns model produces an estimated intrinsic value of $131.40 per share. Against the recent share price of $83.51, this implies the stock is about 36.4% undervalued on this measure.
Result: UNDERVALUED
Our Excess Returns analysis suggests Wells Fargo is undervalued by 36.4%. Track this in your watchlist or portfolio, or discover 42 more high quality undervalued stocks.
Approach 2: Wells Fargo Price vs Earnings
For profitable companies like Wells Fargo, the P/E ratio is a straightforward way to connect what you pay for the stock with the earnings the business is currently generating. It helps you see how many dollars investors are willing to pay today for each dollar of current earnings.
What counts as a "normal" or "fair" P/E ratio usually reflects the balance between growth expectations and risk. Higher expected growth or lower perceived risk can support a higher P/E, while slower growth or higher risk often align with a lower multiple.
Wells Fargo currently trades on a P/E of 12.36x. This sits close to the Banks industry average P/E of 12.33x and below the peer average of 14.35x. Simply Wall St’s Fair Ratio for Wells Fargo is 14.21x. This Fair Ratio is a proprietary estimate of what the P/E could be, given factors such as the company’s earnings profile, its industry, profit margins, market cap and identified risks.
Compared with simple peer or industry comparisons, the Fair Ratio provides a more tailored reference point because it adjusts for these company specific factors. With the current P/E of 12.36x sitting below the Fair Ratio of 14.21x, the stock screens as undervalued on this metric.
Result: UNDERVALUED

P/E ratios tell one story, but what if the real opportunity lies elsewhere? Start investing in legacies, not executives. Discover our 20 top founder-led companies.
Upgrade Your Decision Making: Choose your Wells Fargo Narrative
Earlier the article mentioned that there is an even better way to understand valuation. Meet Narratives, a simple way for you to turn your view of Wells Fargo into a clear story that ties your assumptions about future revenue, earnings and margins to a financial forecast, a fair value estimate and a comparison with today’s price. All of this sits within Simply Wall St’s Community page, where Narratives update automatically when new data such as earnings or news arrives. Different investors might anchor on something close to the US$113.0 upper analyst fair value, or lean toward the more cautious US$85.0 lower view. This gives you an easy reference point for when you think Wells Fargo stock looks expensive or attractive relative to the story you believe in.
Do you think there's more to the story for Wells Fargo? Head over to our Community to see what others are saying!

This article by Simply Wall St is general in nature. We provide commentary based on historical data and analyst forecasts only using an unbiased methodology and our articles are not intended to be financial advice. It does not constitute a recommendation to buy or sell any stock, and does not take account of your objectives, or your financial situation. We aim to bring you long-term focused analysis driven by fundamental data. Note that our analysis may not factor in the latest price-sensitive company announcements or qualitative material. Simply Wall St has no position in any stocks mentioned.