What BXP (BXP)'s Q4 Profit Rebound and Cautious 2026 Outlook Means For Shareholders
BXP Inc BXP | 51.78 | +1.49% |
- In late January 2026, BXP, Inc. reported fourth-quarter 2025 results showing higher revenue of US$877.1 million and a swing to net income of US$248.49 million, while also issuing 2026 earnings guidance of US$0.32–US$0.34 EPS for the first quarter and US$2.08–US$2.29 for the full year.
- Alongside the earnings release, BXP highlighted over US$1 billion of recent asset sale proceeds and ongoing portfolio reshaping, signalling a continued emphasis on balance sheet flexibility and reinvestment into core, higher-quality properties despite persistent office-sector headwinds.
- We’ll examine how BXP’s improved profitability yet cautious 2026 guidance around office leasing demand shapes the company’s broader investment narrative.
Rare earth metals are an input to most high-tech devices, military and defence systems and electric vehicles. The global race is on to secure supply of these critical minerals. Beat the pack to uncover the 32 best rare earth metal stocks of the very few that mine this essential strategic resource.
What Is BXP's Investment Narrative?
For BXP to make sense in a portfolio, you have to buy into the idea that a concentrated set of premier urban offices can still earn solid cash flows, even while the broader office market struggles. The latest quarter supports that case on paper: revenue grew, the company swung back to profit and funds from operations stayed healthy, helped by more than US$1 billion of asset sales that tightened the portfolio and added balance sheet flexibility. At the same time, management’s 2026 EPS and FFO guidance is restrained, flagging that office leasing demand remains soft and that occupancy gains could be slower than previously hoped. That mix of stronger profitability, cautious guidance and a weak recent share price keeps the near term shaped by two catalysts: leasing progress and further capital recycling, set against the risk that interest costs and structurally lower demand drag on returns longer than investors expect.
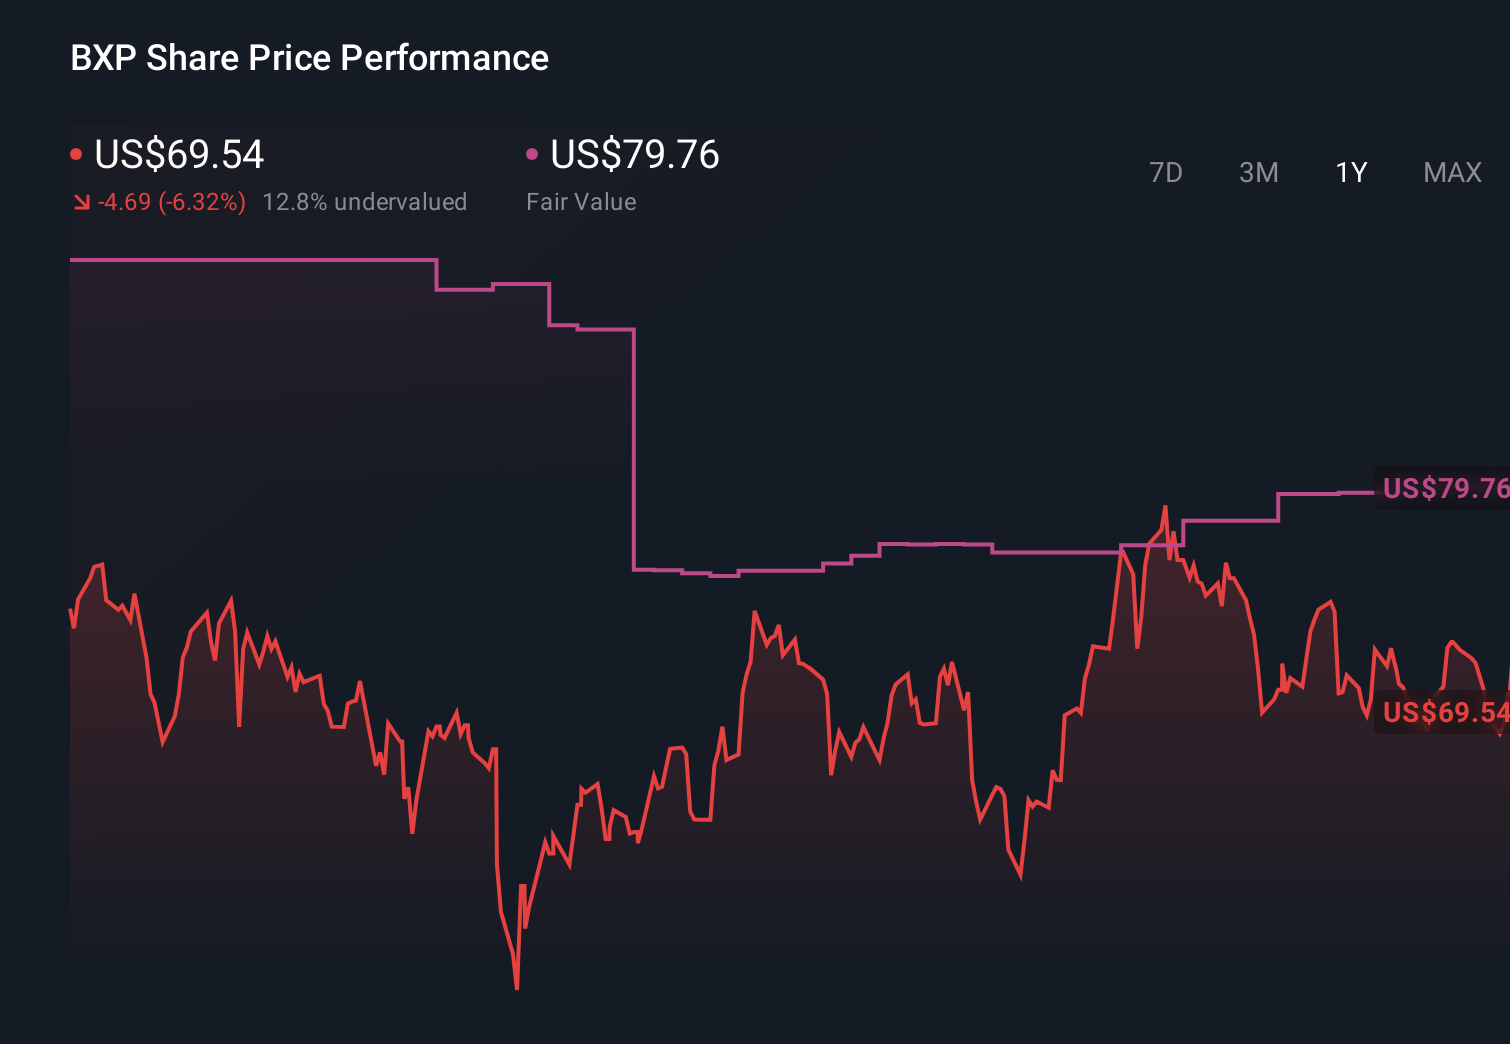
However, the pressure from interest costs and only modest growth expectations is hard to ignore for shareholders. Despite retreating, BXP's shares might still be trading 33% above their fair value. Discover the potential downside here.Exploring Other Perspectives
Four Simply Wall St Community fair value estimates for BXP span roughly US$40 to US$96 per share, highlighting very different views of upside. Set that against management’s cautious 2026 outlook and unresolved office demand risks, and it is clear you should be weighing multiple perspectives before deciding how this business might fit in your portfolio.
Explore 4 other fair value estimates on BXP - why the stock might be worth as much as 49% more than the current price!
Build Your Own BXP Narrative
Disagree with this assessment? Create your own narrative in under 3 minutes - extraordinary investment returns rarely come from following the herd.
- A great starting point for your BXP research is our analysis highlighting 4 key rewards and 3 important warning signs that could impact your investment decision.
- Our free BXP research report provides a comprehensive fundamental analysis summarized in a single visual - the Snowflake - making it easy to evaluate BXP's overall financial health at a glance.
Looking For Alternative Opportunities?
Our top stock finds are flying under the radar-for now. Get in early:
- These 12 companies survived and thrived after COVID and have the right ingredients to survive Trump's tariffs. Discover why before your portfolio feels the trade war pinch.
- Trump has pledged to "unleash" American oil and gas and these 22 US stocks have developments that are poised to benefit.
- The end of cancer? These 29 emerging AI stocks are developing tech that will allow early identification of life changing diseases like cancer and Alzheimer's.
This article by Simply Wall St is general in nature. We provide commentary based on historical data and analyst forecasts only using an unbiased methodology and our articles are not intended to be financial advice. It does not constitute a recommendation to buy or sell any stock, and does not take account of your objectives, or your financial situation. We aim to bring you long-term focused analysis driven by fundamental data. Note that our analysis may not factor in the latest price-sensitive company announcements or qualitative material. Simply Wall St has no position in any stocks mentioned.