What Do New Steel Tariffs and Auto Deals Mean for Cleveland-Cliffs Stock in 2025?
Cleveland-Cliffs Inc CLF | 8.40 | +1.57% |
Trying to make sense of Cleveland-Cliffs stock right now? You are definitely not alone. After a wild ride over the past few years, the company’s shares recently closed at $12.64. Over the past month, it has jumped 11.0%, which might have caught your attention, but in the last week there has been a slight pullback of -1.6%. If you are holding Cleveland-Cliffs or eyeing it for your portfolio, recent moves might seem like whiplash. This is a stock that has more than doubled over five years, up 68.8%, yet it still remains about 2.6% lower than where it was a year ago. Year-to-date, though, the story has been strong with a 32.5% gain, pointing to a solid rebound.
What’s driving all this? For starters, the steel industry is in the spotlight again thanks to tariffs and international trade news. Tariff headlines have been flying. Canada is set to drop many U.S. tariffs but will likely keep hefty import taxes on American steel, and new contracts with automakers have added longer-term certainty to Cleveland-Cliffs’ revenue stream. All this suggests shifting risks and opportunities for investors.
So what about valuation? Are you getting a bargain, or is this stock pricing in all the good news already? Out of six key valuation checks, Cleveland-Cliffs registers as undervalued in three, giving it a valuation score of 3. That is not a screaming deal, but it is not overpriced either. In the next section, let’s break down what these valuation checks actually mean. Later on, I will show you a smarter way to cut through the noise and spot genuine value.
Approach 1: Cleveland-Cliffs Discounted Cash Flow (DCF) Analysis
The Discounted Cash Flow (DCF) model works by projecting a company’s future cash flows and then discounting them back to today. The goal is to estimate what those future dollars are worth now. For Cleveland-Cliffs, the DCF analysis looks at expected Free Cash Flow (FCF) each year and applies a formula that incorporates both analysts’ forecasts and longer-term estimates.
According to the latest data, the company's last twelve months’ FCF was negative, at -$1.49 billion, showing challenges in recent performance. Projections from analysts anticipate a recovery, with FCF expected to reach $427.65 million by 2026 and declining to around $6.77 million by 2035. These later-year figures rely more heavily on extrapolation than on direct analyst coverage. All numbers are referenced in U.S. dollars ($).
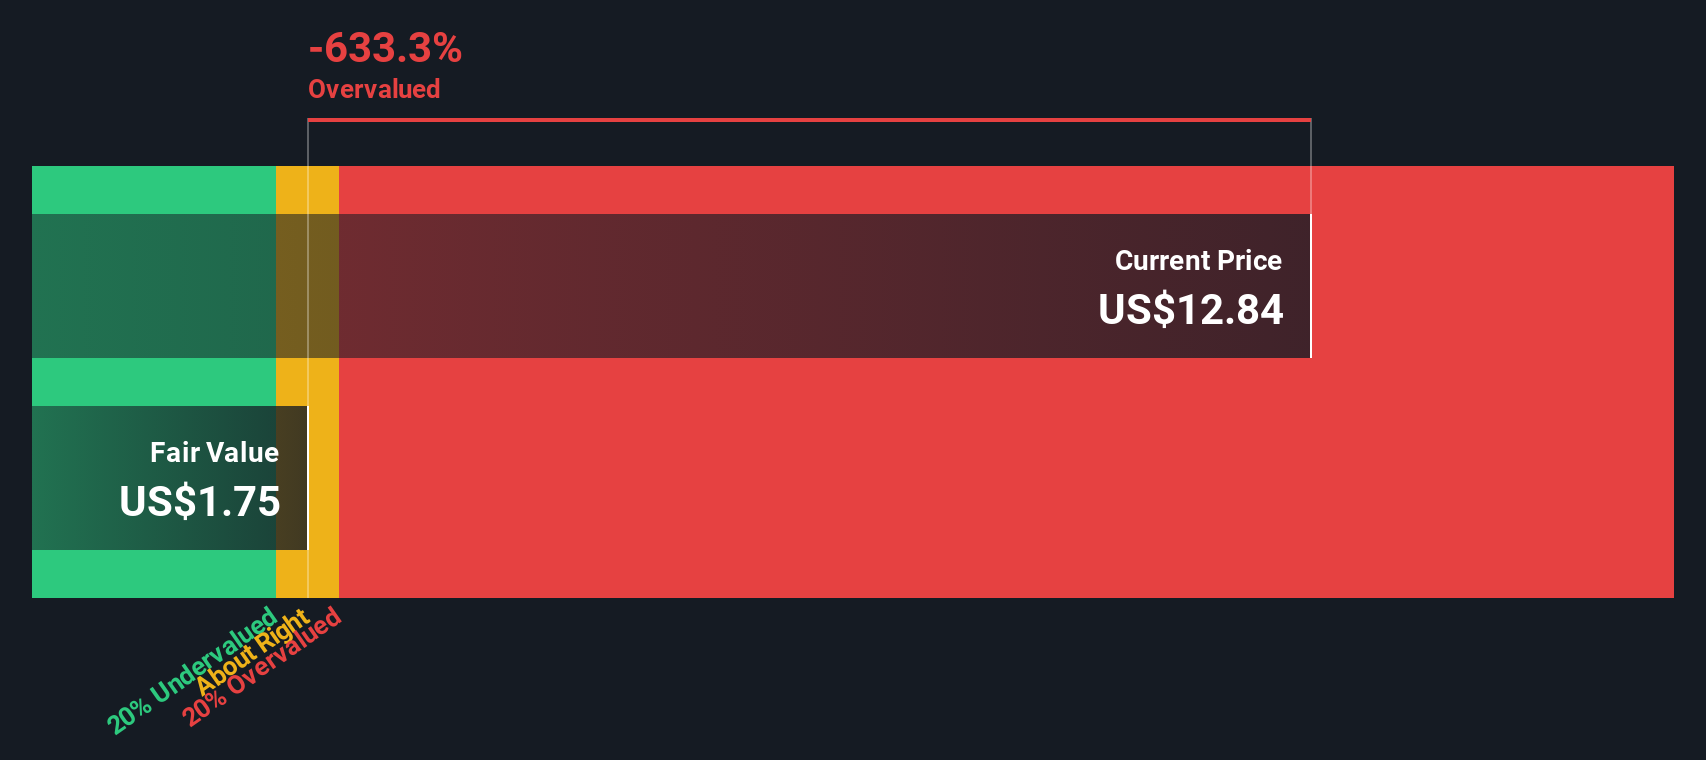
After running these forecasts through the DCF model, the estimated intrinsic value per share is just $1.19. Given that the stock recently closed at $12.64, this suggests Cleveland-Cliffs is trading at a 960.1% premium to what its future cash flows might justify.
This analysis suggests Cleveland-Cliffs may currently be significantly overvalued when measured against what its cash flows could deliver, even when accounting for a possible return to profitability and future growth.
Result: OVERVALUED
Our Discounted Cash Flow (DCF) analysis suggests Cleveland-Cliffs may be overvalued by 960.1%. Find undervalued stocks or create your own screener to find better value opportunities.
Approach 2: Cleveland-Cliffs Price vs Sales (P/S) Analysis
The Price-to-Sales (P/S) ratio is a valuable metric for valuing companies that may not be consistently profitable but generate significant revenue, which is often the case in cyclical industries like steel. For such companies, earnings can swing widely due to commodity cycles, making sales-based multiples a fairer starting point for comparison. Generally, growth expectations and risk profile play a big role in what a "normal" or "fair" P/S ratio should be. A rapidly growing, lower-risk company might be justified at a higher multiple, while more volatile or slow-growing firms usually warrant a lower one.
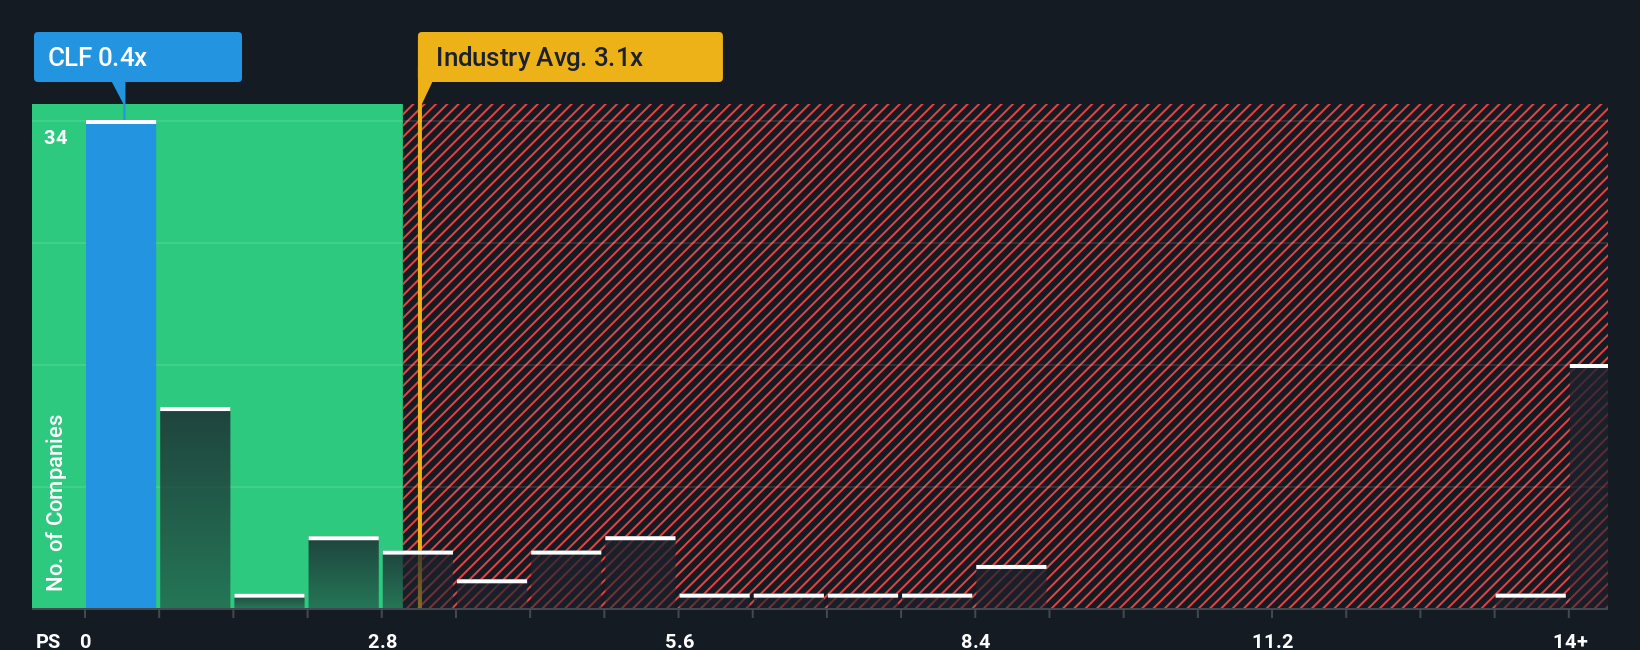
Cleveland-Cliffs currently trades at a P/S ratio of 0.34x. To put that into perspective, the average for its metals and mining industry peers is about 1.60x, while the wider sector norm is even higher at 2.75x. On a simple comparison, Cleveland-Cliffs looks much cheaper than both its direct competitors and the overall industry.
However, Simply Wall St's "Fair Ratio" offers a more comprehensive valuation tool by accounting for Cleveland-Cliffs' unique blend of factors, including its growth prospects, risks, profit margin, industry trends, and market capitalization. The Fair Ratio calculated for the company is 0.81x, reflecting what an informed investor might expect for a business with Cleveland-Cliffs’ characteristics. This approach is more robust than peer or sector averages because it tailors the benchmark specifically to the company, not just the group.
Comparing the Fair Ratio of 0.81x to the current P/S ratio of 0.34x, Cleveland-Cliffs appears undervalued based on this preferred multiple.
Result: UNDERVALUED
PS ratios tell one story, but what if the real opportunity lies elsewhere? Discover companies where insiders are betting big on explosive growth.
Upgrade Your Decision Making: Choose your Cleveland-Cliffs Narrative
Earlier we mentioned that there is an even better way to understand valuation, so let’s introduce you to Narratives. A Narrative connects your view of Cleveland-Cliffs’ business story to its numbers, making it easy to see how your expectations and assumptions about the company translate into a personal fair value estimate.
Instead of just looking at price targets or ratios, Narratives help you shape and test your own story. What could revenue, earnings, and margins look like as Detroit automakers reshore and tariffs shift? With Narratives, you define those assumptions, and in moments see them linked to a financial forecast and a value per share, so the "why" behind the number is crystal clear.
This approach is simple and accessible. On Simply Wall St’s Community page, millions of investors are already sharing and updating their Narratives as new news or earnings data is released, so you can see a wide range of perspectives evolve in real time.
Narratives also make decision-making straightforward. You can instantly compare your calculated Fair Value with the market price to decide if you think it is time to buy, hold, or sell.
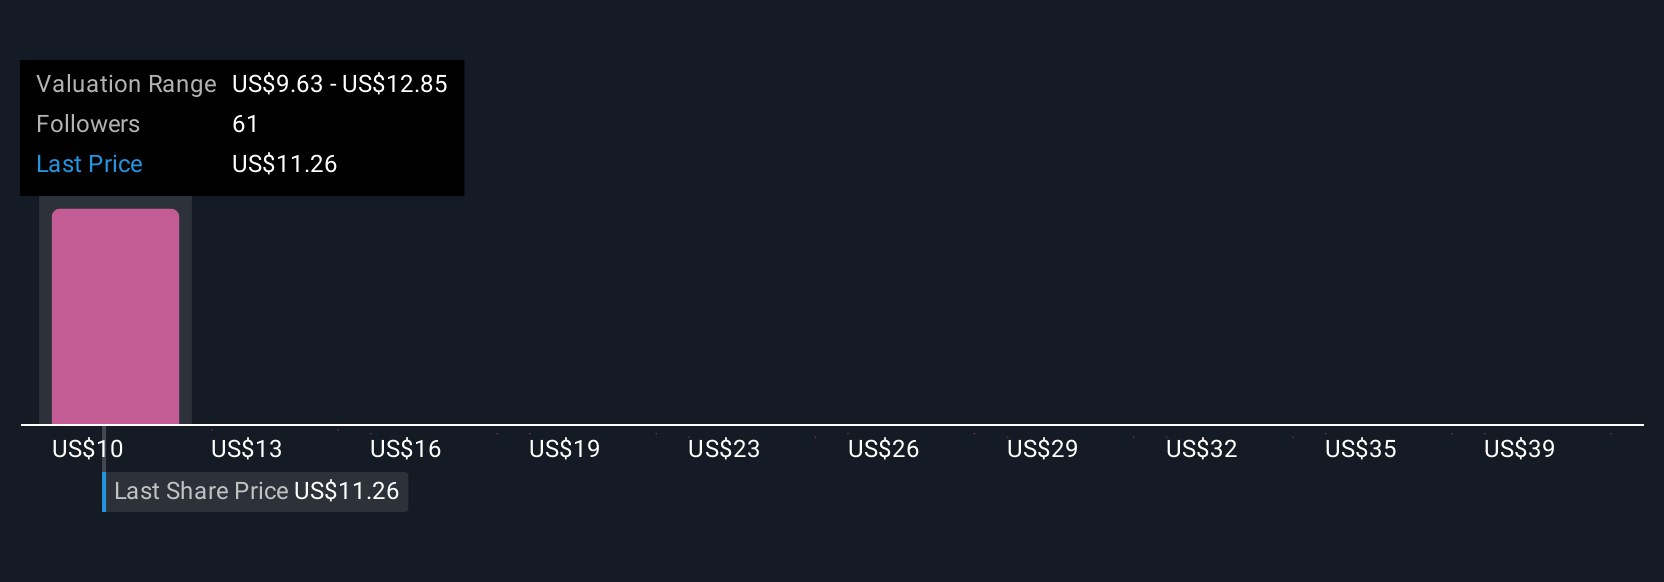
For Cleveland-Cliffs, Narratives range from bullish investors expecting tariff-driven demand and margin rebound ($14.0 fair value) to cautious skeptics worried about overcapacity or cost pressures ($5.0 fair value), so you can see exactly how investor expectations shape their conclusions.
Do you think there's more to the story for Cleveland-Cliffs? Create your own Narrative to let the Community know!
This article by Simply Wall St is general in nature. We provide commentary based on historical data and analyst forecasts only using an unbiased methodology and our articles are not intended to be financial advice. It does not constitute a recommendation to buy or sell any stock, and does not take account of your objectives, or your financial situation. We aim to bring you long-term focused analysis driven by fundamental data. Note that our analysis may not factor in the latest price-sensitive company announcements or qualitative material. Simply Wall St has no position in any stocks mentioned.