What General Dynamics (GD)'s Strong Q4 Sales and Record Defense Backlog Means For Shareholders
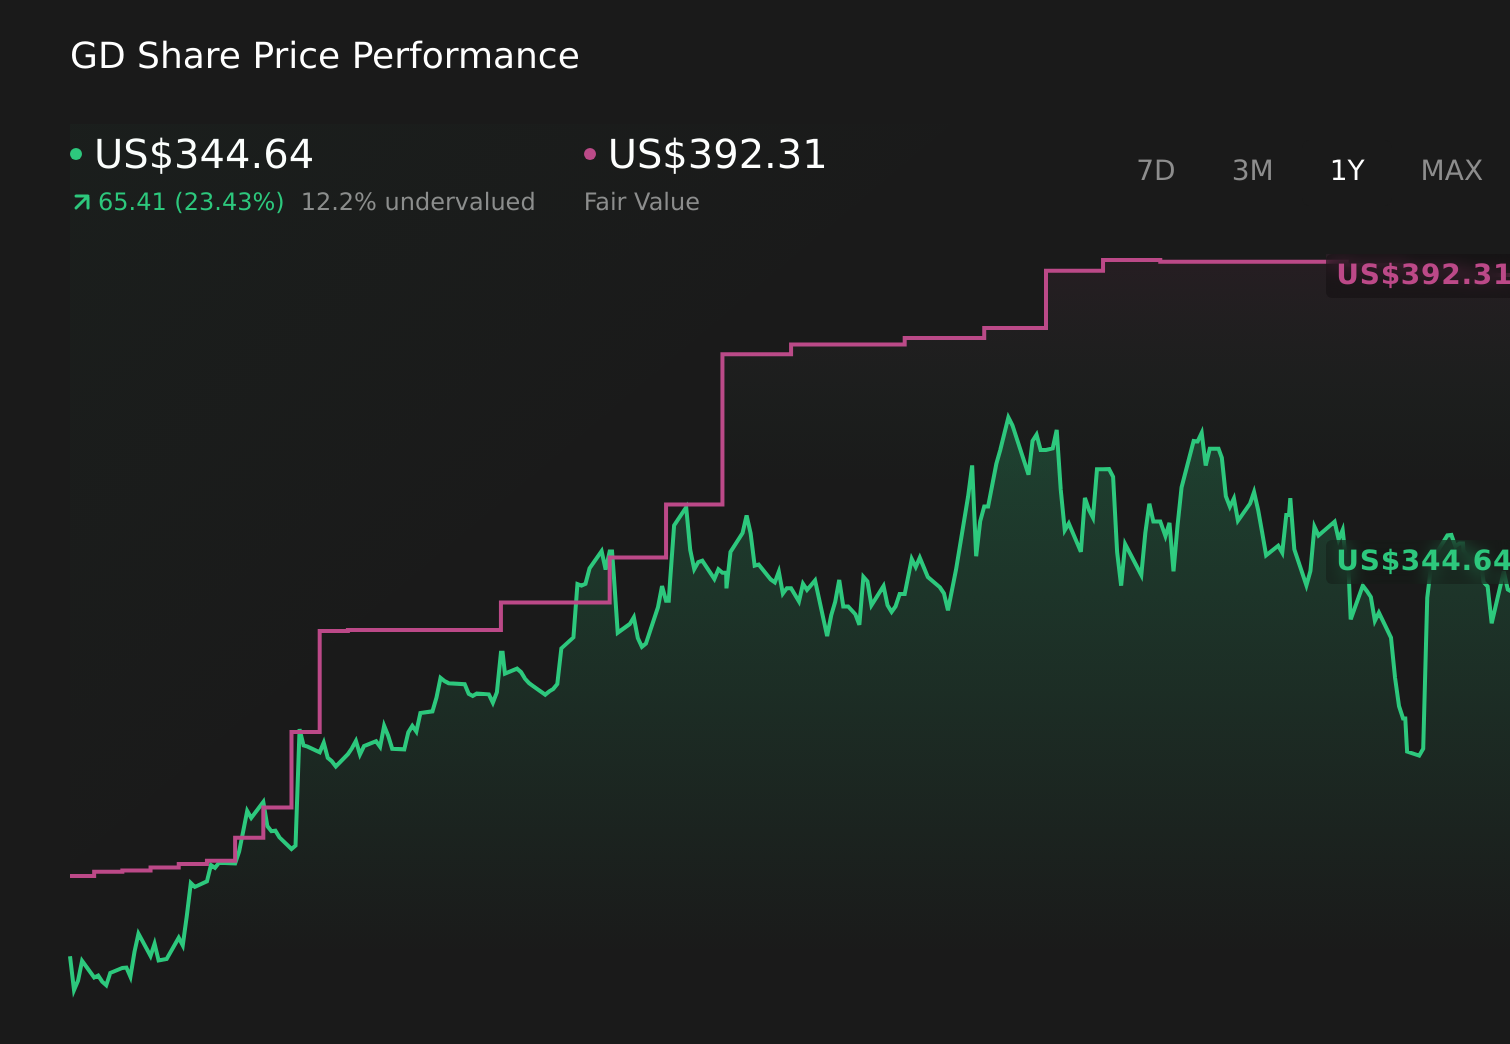
General Dynamics Corporation GD | 349.09 | -0.41% |
- General Dynamics Corporation reported fourth-quarter 2025 results, with sales rising to US$14,379 million from US$13,338 million a year earlier, while net income was broadly stable at US$1,143 million versus US$1,148 million.
- Beyond the headline figures, the quarter underscored strong operational execution, supported by Gulfstream’s G700 program and a record multibillion-dollar defense backlog that is helping drive broad-based cash generation.
- We’ll now explore how this combination of higher sales and a record defense backlog shapes General Dynamics’ investment narrative going forward.
AI is about to change healthcare. These 108 stocks are working on everything from early diagnostics to drug discovery. The best part - they are all under $10b in market cap - there's still time to get in early.
What Is General Dynamics' Investment Narrative?
To own General Dynamics, you need to be comfortable with a diversified defense and aerospace group where much of the story rests on steady execution against a very large, long-cycle order book. The latest quarter supports that view: sales grew while earnings held effectively flat, and management highlighted strong cash generation across segments, underpinned by the G700 program and a US$109.90 billion defense backlog. In the near term, catalysts still center on converting that backlog into revenue and cash, ongoing G700 milestones, and how leadership balances dividends, buybacks and debt reduction. The new earnings print does not radically change those drivers, but it does modestly reinforce confidence in operations while leaving key risks intact, particularly around defense budgeting, program timing and aerospace demand.
However, one of the most important risks is less visible at first glance and deserves attention. Despite retreating, General Dynamics' shares might still be trading 6% above their fair value. Discover the potential downside here.Exploring Other Perspectives
Explore 6 other fair value estimates on General Dynamics - why the stock might be worth as much as 11% more than the current price!
Build Your Own General Dynamics Narrative
Disagree with this assessment? Create your own narrative in under 3 minutes - extraordinary investment returns rarely come from following the herd.
- A great starting point for your General Dynamics research is our analysis highlighting 5 key rewards that could impact your investment decision.
- Our free General Dynamics research report provides a comprehensive fundamental analysis summarized in a single visual - the Snowflake - making it easy to evaluate General Dynamics' overall financial health at a glance.
Looking For Alternative Opportunities?
These stocks are moving-our analysis flagged them today. Act fast before the price catches up:
- The end of cancer? These 29 emerging AI stocks are developing tech that will allow early identification of life changing diseases like cancer and Alzheimer's.
- These 14 companies survived and thrived after COVID and have the right ingredients to survive Trump's tariffs. Discover why before your portfolio feels the trade war pinch.
- Outshine the giants: these 25 early-stage AI stocks could fund your retirement.
This article by Simply Wall St is general in nature. We provide commentary based on historical data and analyst forecasts only using an unbiased methodology and our articles are not intended to be financial advice. It does not constitute a recommendation to buy or sell any stock, and does not take account of your objectives, or your financial situation. We aim to bring you long-term focused analysis driven by fundamental data. Note that our analysis may not factor in the latest price-sensitive company announcements or qualitative material. Simply Wall St has no position in any stocks mentioned.