What GRAIL (GRAL)'s Narrowed Q1 Loss And Revenue Growth Means For Shareholders
Grail GRAL | 0.00 |
- GRAIL, Inc. has reported its first-quarter 2026 results, with sales of US$39.83 million and revenue of US$40.79 million, alongside a net loss of US$93.19 million and basic and diluted loss per share from continuing operations of US$2.29, all reflecting improvement versus the same period a year earlier.
- The combination of rising revenue and a smaller net loss suggests early benefits from GRAIL’s efforts to scale its multi-cancer early detection business while tightening cost control.
- We’ll now examine how GRAIL’s narrowed quarterly loss, alongside revenue growth, shapes the company’s existing investment narrative and risk profile.
The future of work is here. Discover the 35 top robotics and automation stocks leading the charge in AI-driven automation and industrial transformation.
GRAIL Investment Narrative Recap
To own GRAIL, you need to believe that multi cancer early detection can become a routine part of screening and that Galleri can capture a meaningful share of that opportunity. The latest quarter’s higher revenue and narrower loss help, but do not materially alter the near term catalysts around FDA review, payer coverage and execution on commercial partnerships. The biggest risk remains sustained heavy losses and cash burn if test volumes and pricing do not scale as hoped.
Among recent updates, the Q1 2026 earnings release is most relevant here, as it directly tracks how GRAIL is managing its loss profile while trying to grow Galleri adoption. The improved net loss of US$93.19 million versus US$106.21 million a year earlier modestly eases near term financial pressure, but it also underlines how dependent the story still is on future regulatory decisions and reimbursement progress to support the investment case.
Yet set against this progress, investors should also be aware that...
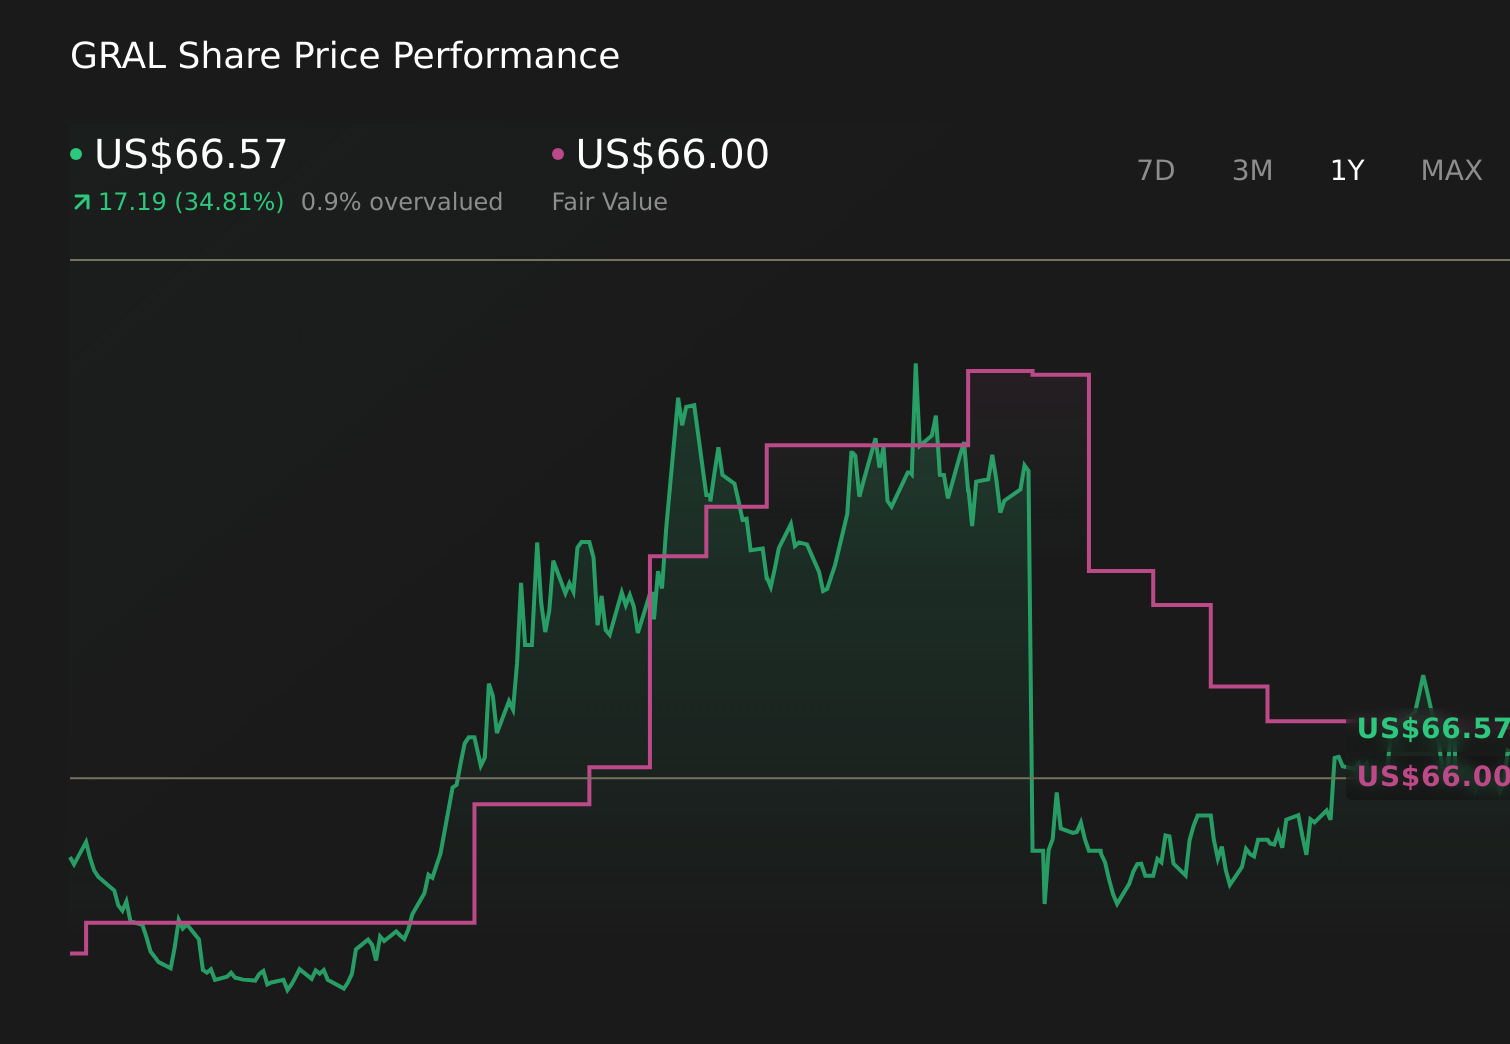
GRAIL's narrative projects $287.3 million revenue and $42.6 million earnings by 2029. This requires 25.0% yearly revenue growth and a $451.0 million earnings increase from -$408.4 million today.
Uncover how GRAIL's forecasts yield a $67.71 fair value, a 24% upside to its current price.
Exploring Other Perspectives
Some of the most optimistic analysts were assuming roughly 32.6 percent annual revenue growth and future margins closer to sector averages, which paints a far more upbeat path than the consensus view. With Q1’s improved but still large US$93.19 million loss, you can see how the new information could either support or challenge that more optimistic narrative, depending on how you weigh the funding runway and regulatory milestones ahead.
Explore 5 other fair value estimates on GRAIL - why the stock might be worth over 2x more than the current price!
Form Your Own Verdict
Don't just follow the ticker - dig into the data and build a conviction that's truly your own.
- A great starting point for your GRAIL research is our analysis highlighting 1 key reward and 5 important warning signs that could impact your investment decision.
- Our free GRAIL research report provides a comprehensive fundamental analysis summarized in a single visual - the Snowflake - making it easy to evaluate GRAIL's overall financial health at a glance.
Searching For A Fresh Perspective?
The market won't wait. These fast-moving stocks are hot now. Grab the list before they run:
- Capitalize on the AI infrastructure supercycle with our selection of the 38 best 'picks and shovels' of the AI gold rush converting record-breaking demand into massive cash flow.
- Invest in the nuclear renaissance through our list of 91 elite nuclear energy infrastructure plays powering the global AI revolution.
- The best AI stocks today may lie beyond giants like Nvidia and Microsoft. Find the next big opportunity with these 19 smaller AI-focused companies with strong growth potential through early-stage innovation in machine learning, automation, and data intelligence that could fund your retirement.
This article by Simply Wall St is general in nature. We provide commentary based on historical data and analyst forecasts only using an unbiased methodology and our articles are not intended to be financial advice. It does not constitute a recommendation to buy or sell any stock, and does not take account of your objectives, or your financial situation. We aim to bring you long-term focused analysis driven by fundamental data. Note that our analysis may not factor in the latest price-sensitive company announcements or qualitative material. Simply Wall St has no position in any stocks mentioned.