What Order Flow Data Is Saying As Market Drops
Sector Flows — TradePulse | June 23, 2026
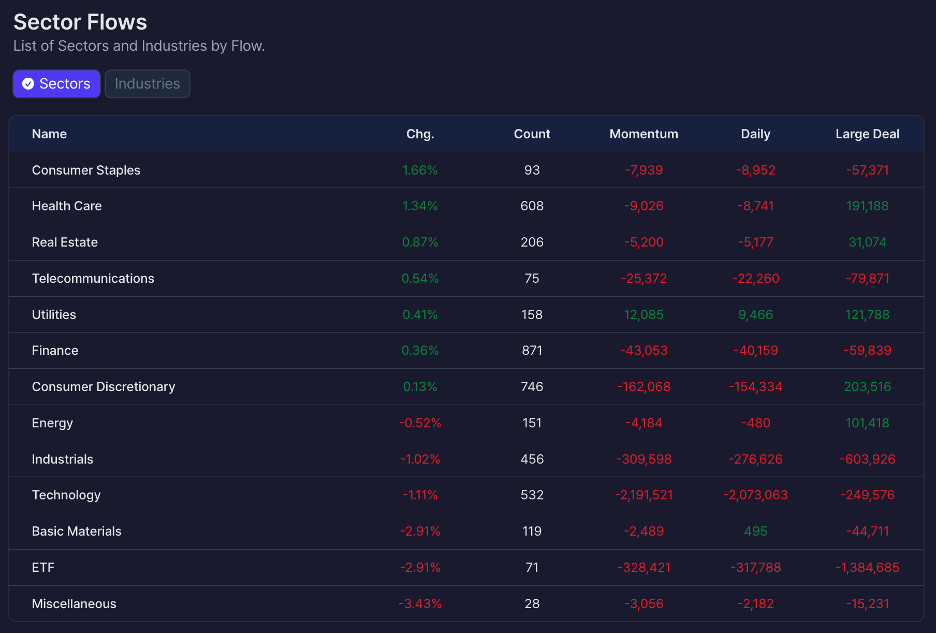
All Data as of 2:00PM EST
What Order Flow Data Is Saying As Market Drops
Price moves get the headlines. Flow data tells the real story.
During the June 23rd trading session, Technology is clearly a sector under pressure, down -1.11% across more than 500 securities. On the surface, it looks like a mild pullback, but the order flow data reveals broad selling action. Momentum and Daily Flow are both deeply negative, while Large Deal activity is the only area not showing the same level of selling pressure.
Utilities is the most straightforward trend in sector flows. Price is up, momentum is positive, daily flow is positive, and large deal activity is strongly positive. When all four align like this, it tends to stand out and point to significant trend.
Health Care also shows strong large deal activity at +191,188, but the broader flow picture is mixed. Momentum and daily flow are still negative despite a solid positive price move, suggesting participation is uneven rather than fully committed.
Real Estate has positive price action, but slightly negative momentum and daily flow, with modest positive large deal support.
Consumer Discretionary stands out for a different reason. Despite a barely positive price move, it shows heavy negative momentum and daily flow, but strong positive large deal activity at +203,516. That kind of divergence often signals selective accumulation underneath broader selling pressure.
The Sectors Seeing Money Walk Out the Door
Technology is the dominant outflow sector. Momentum is deeply negative (-2.19M), daily flow is sharply negative (-2.07M), and large deal activity is also negative (-249,576). This is not just a pullback, it’s broad-based distribution.
ETFs are also under heavy pressure, with momentum at -328,421, daily flow at -317,788, and a large deal print of -1.38M. That kind of consistent selling across everything suggests investors are pulling risk across the board, not just rotating from one sector into another.
Industrials are another major outflow sector, with negative price action and some of the largest negative flow readings in the entire table, especially large deal activity at -603,926. That number indicates sustained institutional selling pressure.
Consumer Staples, despite a strong +1.66% price move, is seeing negative momentum, negative daily flow, and meaningful large deal outflows. That type of divergence is worth following, since there is price strength without underlying flow support.
What This Actually Means
The market isn’t seeing broad inflows right now. Instead, it’s uneven, with a few sectors like Utilities, showing steady buying, while most of the market is still seeing consistent outflows. Flow data doesn’t predict the future, but it does show where money is moving. The order flow appears concentrated in a handful of sectors, while much of the rest of the market shows weaker or inconsistent participation. This setup points to rotation and selective positioning rather than broad buying activity.
This material is for informational purposes only and should not be construed as investment advice or a recommendation to buy or sell any security. Past performance and observed flows are not indicative of future results.
Benzinga Disclaimer: This article is from an unpaid external contributor. It does not represent Benzinga’s reporting and has not been edited for content or accuracy.