What Recent Housing Data Means for Lennar’s Stock Outlook in 2025
Lennar Corporation Class A LEN | 86.49 86.49 | +1.23% 0.00% Post |
Trying to decide what to do with Lennar stock right now? You are not alone. Lennar, one of America’s largest homebuilders, has been on quite a journey for investors. Over just the past year, shares have slid by nearly 26%, which is a sharp reversal after sizable gains in the three- and five-year periods. In fact, looking at the past three years, Lennar is still up more than 90%, and 74.6% for five years. So, if you are feeling mixed signals, that is understandable!
Recent weeks tell a story of caution in the market, as Lennar’s shares have dropped 1% in the last week and are down by 5.5% for the month. Some of this caution may reflect buyers and investors wondering about the outlook for the housing market and how recent interest rate trends could impact demand for new homes. There are also plenty of macro uncertainties swirling around, impacting housing more broadly. Still, Lennar’s long-term track record reminds us that markets can change course fast, either for better or worse.
On valuation, Lennar currently scores a 1 out of 6, meaning it appears undervalued in only one of the standard checks that analysts use. That might leave some investors asking whether the recent pullback is a buying opportunity or a signal to be even more cautious. Next, let’s break down how Lennar looks through some of the most common valuation lenses. There is also a more holistic way to make sense of all these numbers that we will get to at the end.
Lennar scores just 1/6 on our valuation checks. See what other red flags we found in the full valuation breakdown.Approach 1: Lennar Discounted Cash Flow (DCF) Analysis
The Discounted Cash Flow (DCF) model estimates a company's underlying value by projecting its future cash flows and then discounting them back to today's value. This gives investors a sense of what the business is truly worth based on its ability to generate cash.
For Lennar, the most recent Free Cash Flow is $278 million. Analyst forecasts and extrapolations from Simply Wall St suggest that by 2026, Lennar's annual Free Cash Flow could reach as high as $2.15 billion. Looking further ahead, 10-year projections estimate Free Cash Flow might rise to approximately $1.86 billion by 2035, though these long-range numbers rely partly on algorithmic extrapolation rather than analyst consensus.
Using this two-stage DCF approach, Lennar's estimated intrinsic value per share is $105.15. However, the analysis also shows the stock is trading at an implied premium, with a DCF intrinsic discount of -19.9%. This means the current share price is about 19.9% higher than what the DCF model suggests is fair value, which makes Lennar appear overvalued according to this methodology.
Result: OVERVALUED
Head to the Valuation section of our Company Report for more details on how we arrive at this Fair Value for Lennar.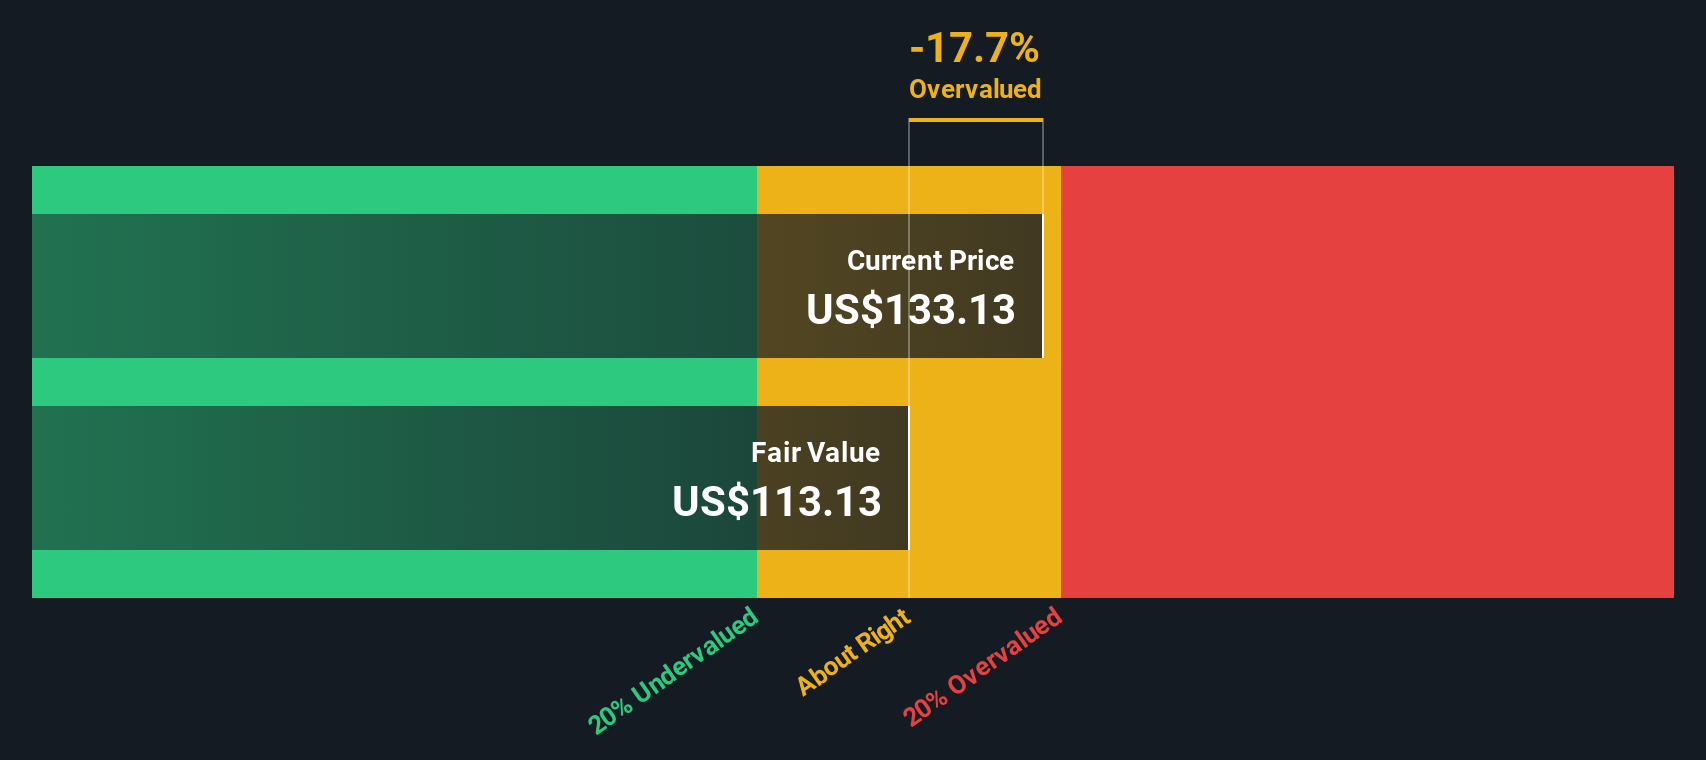
Approach 2: Lennar Price vs Earnings
The Price-to-Earnings ratio, or PE, is widely used to value profitable companies like Lennar because it puts the company’s share price in perspective with the actual earnings it generates. In essence, it shows how much investors are paying right now for every dollar of earnings. For established, consistently profitable businesses, this can be a much more telling metric than sales or book value ratios.
The “right” or fair PE ratio often depends on how quickly investors expect the company to grow and the risks involved in achieving that growth. Higher growth or lower risk should support a higher PE, while slower growth or greater uncertainty usually means a lower multiple is justified.
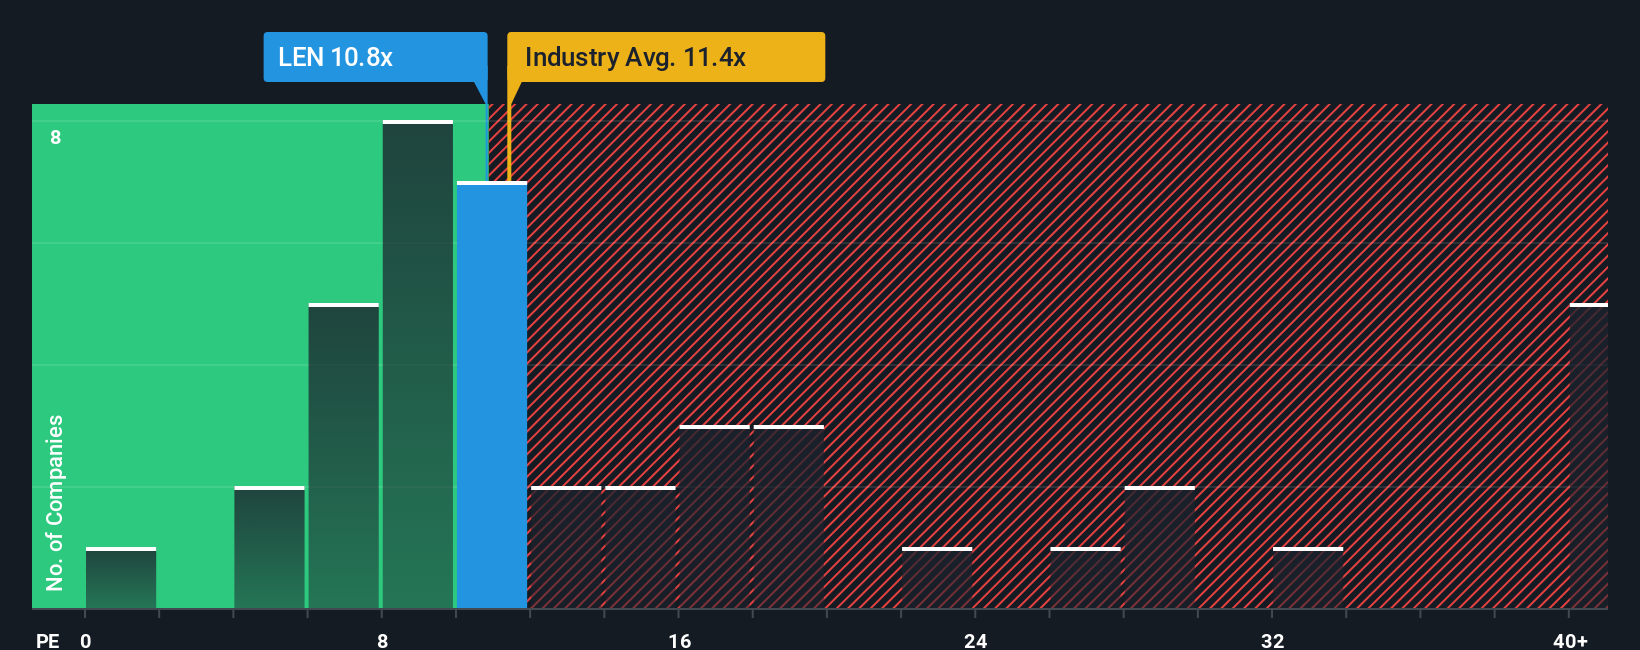
Currently, Lennar trades at a PE of 12.3x. That is slightly above the average for peers (11.7x) and the broader Consumer Durables industry (11.7x). However, Simply Wall St uses a more tailored benchmark, the “Fair Ratio.” For Lennar, this is estimated at 17.7x. This considers Lennar’s earnings growth prospects, industry, profit margins, market cap, and overall risk, offering a more nuanced view than a simple peers or industry comparison.
Comparing Lennar’s actual PE (12.3x) with its Fair Ratio (17.7x) suggests the stock is trading well below what might be considered fair value. In this context, Lennar looks attractive from a PE perspective.
Result: UNDERVALUED
Upgrade Your Decision Making: Choose your Lennar Narrative
Earlier, we mentioned that there is an even better way to understand valuation, so let’s introduce you to Narratives. A Narrative is simply the story you believe about a company, your outlook on its future, supported by what you expect in terms of revenue, earnings, and profit margins. Narratives connect these expectations to a financial forecast and then to a specific fair value for the company, letting you translate your unique view into concrete, actionable numbers.
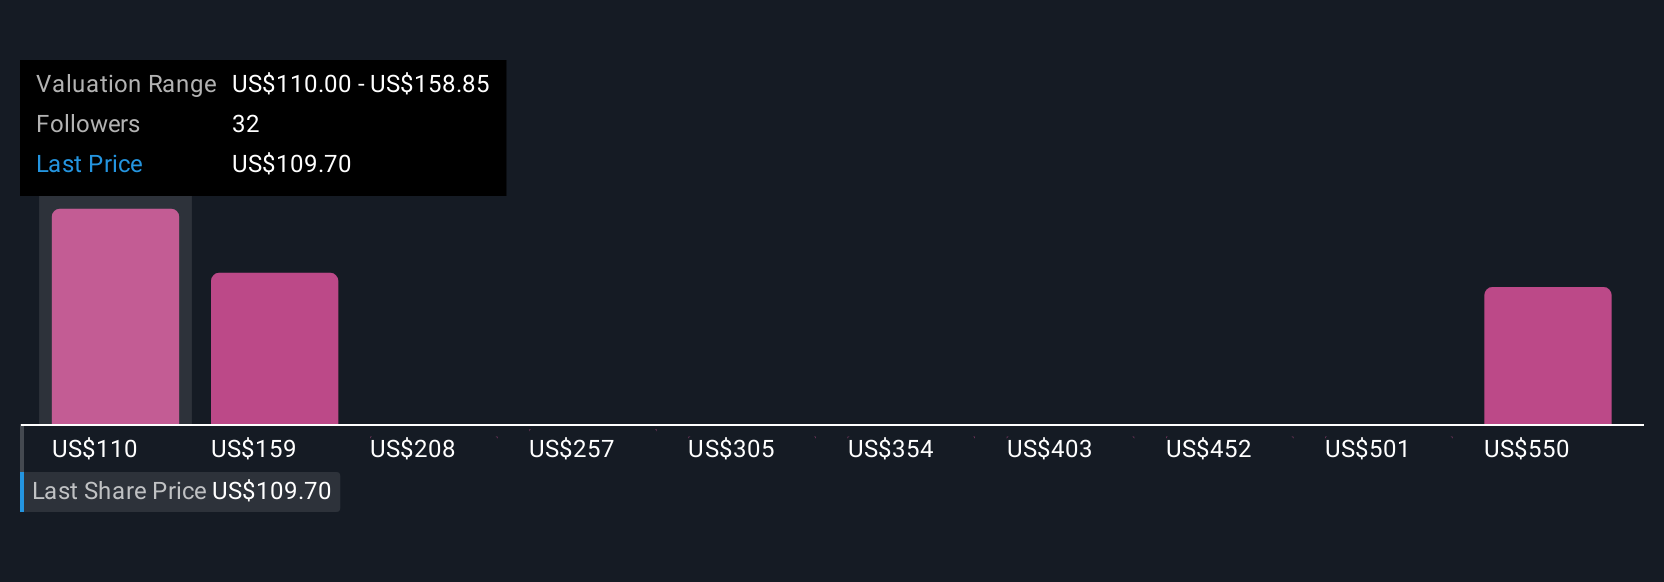
On Simply Wall St's Community page, millions of investors use Narratives as an easy tool for making decisions, comparing each Narrative’s Fair Value with the company’s current share price to decide if, when, and why to buy or sell. Narratives update in real time as news or company results are released, so your thesis can evolve alongside the market. For example, one Lennar Narrative projects robust long-term earnings growth and a fair value above $160, while another, more cautious view points to shrinking margins and a fair value nearer $95. This demonstrates how different perspectives shape investment decisions.
For Lennar, we’ll make it really easy for you with previews of two leading Lennar Narratives:
- 🐂 Lennar Bull Case
Fair Value: $162.49
Current Price is 22.4% below this Narrative's fair value
Revenue Growth Rate: 5.67%
- Forecasts mild near-term gains due to high mortgage rates, but expects strong long-term growth as demand recovers and rates eventually decline.
- Political and regulatory changes, especially affordability policies, are seen as likely to benefit Lennar and the broader homebuilding sector.
- Despite current oversupply and weak demand, the narrative highlights the structural housing shortfall in the U.S. as a powerful catalyst for future growth, particularly in affordable housing markets like Texas.
- 🐻 Lennar Bear Case
Fair Value: $125.43
Current Price is 0.5% above this Narrative's fair value
Revenue Growth Rate: 4.33%
- Sees Lennar’s transition to an asset-light model, acquisitions, and efficiency measures as supportive of long-term positioning. However, expects narrower profit margins over the next few years.
- Analyst consensus anticipates revenue and earnings growth will be limited by high mortgage rates, constrained consumer confidence, and elevated construction costs.
- With current pricing slightly above fair value, this view cautions that Lennar is close to fully valued unless profitability improves beyond current analyst expectations.
This article by Simply Wall St is general in nature. We provide commentary based on historical data and analyst forecasts only using an unbiased methodology and our articles are not intended to be financial advice. It does not constitute a recommendation to buy or sell any stock, and does not take account of your objectives, or your financial situation. We aim to bring you long-term focused analysis driven by fundamental data. Note that our analysis may not factor in the latest price-sensitive company announcements or qualitative material. Simply Wall St has no position in any stocks mentioned.