What the Recent NASA Contract Means for Redwire’s Share Price in 2025
Redwire Corp RDW | 9.73 | +7.16% |
If you are considering what to do with Redwire stock right now, you are definitely not alone. Few stocks have managed to capture the same level of investor curiosity and debate, and it is easy to see why. Redwire's share price has experienced some noticeable swings lately, climbing 2.4% in the last week and adding another 1.3% over the past 30 days. Of course, that cannot erase a tough start to the year, with year-to-date returns still down a hefty 45.9%. However, taking a step back, the one-year gain of 44.3% and a significant 268.8% increase over the last three years show that real growth potential exists for those who time their moves carefully.
What is driving this volatility? Much of it comes down to shifting risk perceptions in the broader space and defense sector. Redwire has also benefited from recent market optimism around commercial space infrastructure and advances in satellite manufacturing. These broader trends have contributed to short-term gains as investors reassess the company’s role in a rapidly expanding market.
However, price moves only tell part of the story. When it comes to value, Redwire scores a 2 on our six-point valuation check, which means it is considered undervalued by two key measures. This is not a dramatic win, but it does suggest the stock is trading at a discount in some important respects.
How do these valuation approaches compare, and what do they reveal for investors weighing their next move? Here is a breakdown of the numbers behind Redwire’s value, along with a new perspective on valuation that may provide an even clearer advantage.
Redwire scores just 2/6 on our valuation checks. See what other red flags we found in the full valuation breakdown.Approach 1: Redwire Discounted Cash Flow (DCF) Analysis
The Discounted Cash Flow (DCF) model estimates a company's intrinsic value by projecting its future cash flows and discounting them back to today's dollars. This method focuses on how much money Redwire is likely to generate for shareholders in the years ahead, adjusting those figures for risk and the time value of money.
Redwire's most recent free cash flow is negative at $-154.07 million, reflecting ongoing investment or operating losses. However, analysts forecast a substantial turnaround, with projected free cash flow reaching $73.1 million by 2027. Looking further out over the next decade, projections based on both analyst input and extrapolations expect continued growth, with discounted future cash flows rising steadily each year through 2035.
Based on the 2 Stage Free Cash Flow to Equity model, the DCF calculation arrives at an estimated intrinsic fair value of $17.81 per share. Importantly, this figure is 48.2% above the current share price, suggesting that Redwire stock is significantly undervalued according to this method.
Result: UNDERVALUED
Head to the Valuation section of our Company Report for more details on how we arrive at this Fair Value for Redwire.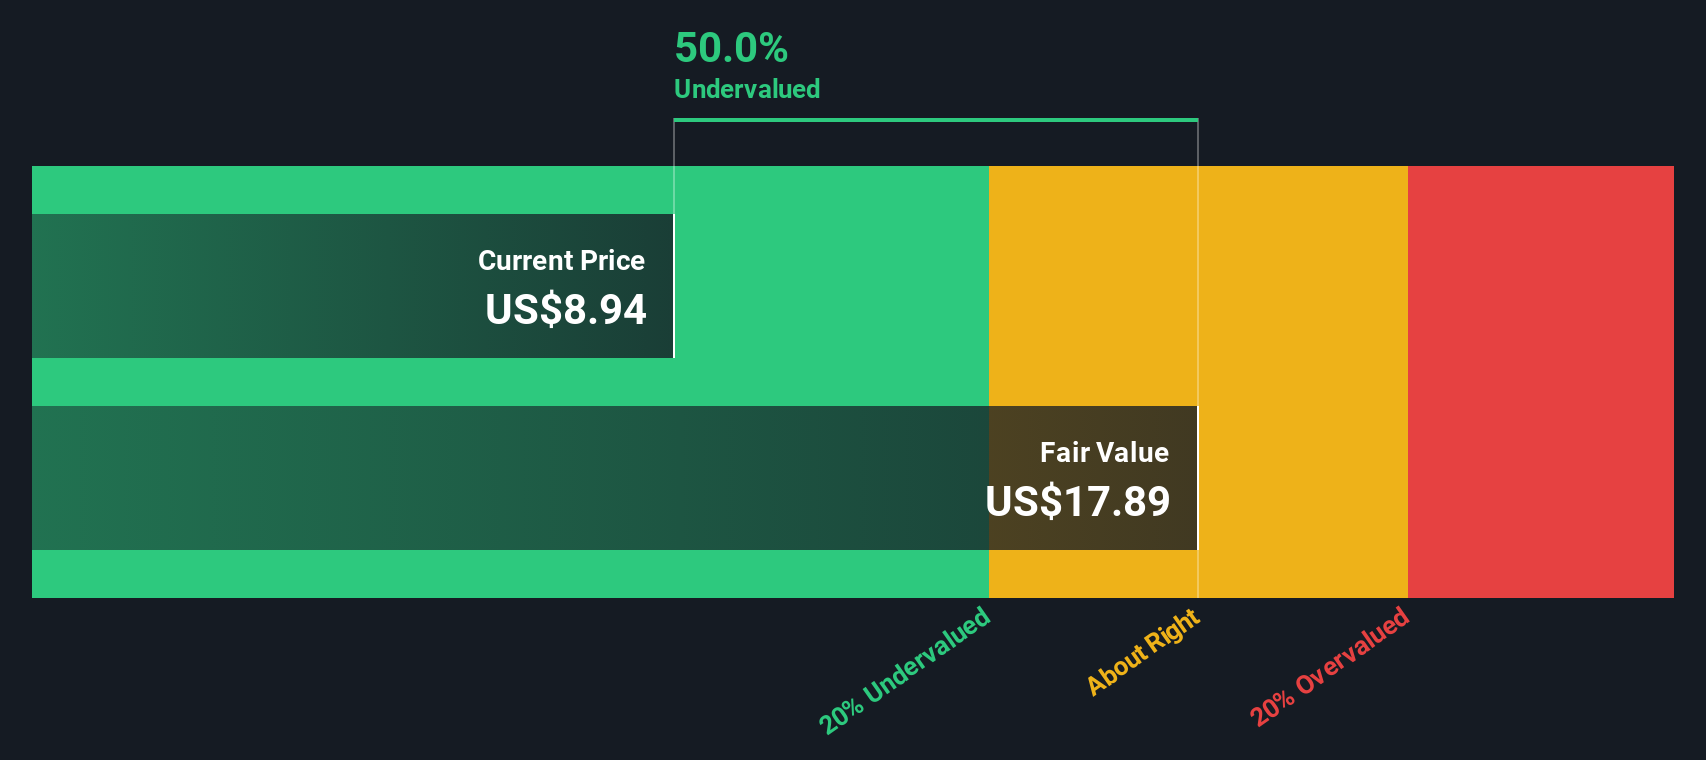
Approach 2: Redwire Price vs Sales
The price-to-sales (P/S) ratio is a useful valuation metric, especially for companies like Redwire that may not yet be consistently profitable. The P/S multiple allows investors to assess how much they are paying for each dollar of the company’s revenue, making it helpful for growth or early-stage businesses where earnings may not fully reflect underlying momentum.
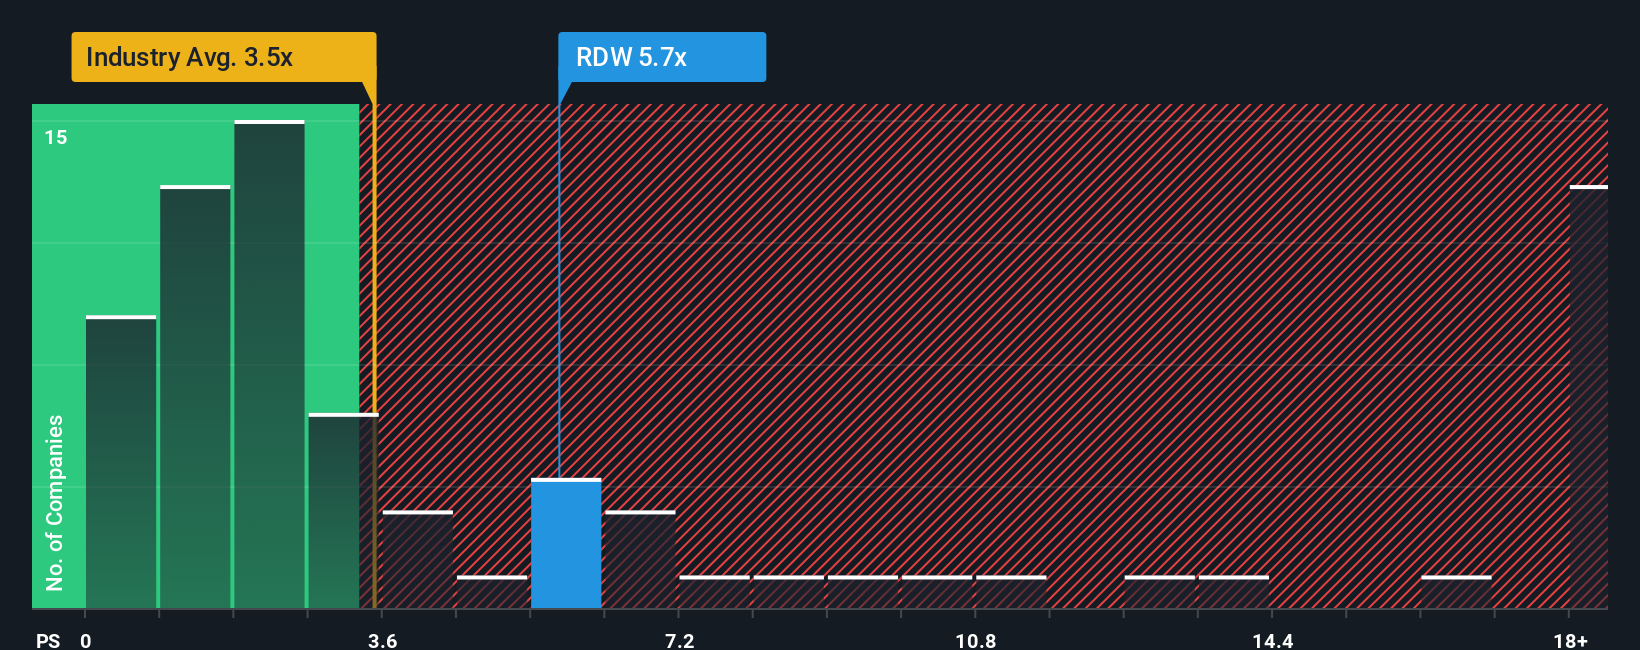
When applying the P/S ratio, it's important to account for growth prospects and risk. Higher expected growth or lower risk typically justifies a higher P/S ratio, while heightened risks or slower growth mean a lower multiple is considered fair. Looking at Redwire, the current P/S ratio stands at 5.47x. This is notably above the Aerospace & Defense industry average of 3.01x and higher than the peer average of 1.66x, signaling that investors are assigning a premium to Redwire’s revenues compared to other sector players.
But instead of relying solely on peer or industry averages, Simply Wall St’s proprietary "Fair Ratio" provides a more tailored benchmark. The Fair Ratio for Redwire is 2.22x, calculated by taking into account the company’s specific growth, profit margins, industry characteristics, market cap and risk profile. Since the Fair Ratio reflects a more holistic perspective, it offers a better sense of what the company is truly worth given its unique circumstances.
With Redwire’s actual P/S ratio of 5.47x significantly higher than its Fair Ratio of 2.22x, this suggests the stock is overvalued based on its current revenues and risk-adjusted prospects.
Result: OVERVALUED
Upgrade Your Decision Making: Choose your Redwire Narrative
Earlier we mentioned that there is an even better way to understand valuation, so let's introduce you to Narratives. A Narrative is simply your story, or perspective, about a company: what you believe about its future growth, risks, and how much it should be worth. You can tie this directly to forecasts for revenue, earnings, margins, and a fair value estimate.
Narratives help investors make sense of the numbers by connecting Redwire’s business story and industry developments to a dynamic valuation. This makes it easier to decide when to buy or sell by comparing your fair value to the company’s current price. On Simply Wall St’s Community page, you can easily explore existing Redwire Narratives or create your own, seeing how millions of investors link specific business drivers and forecasts with valuation.
What makes Narratives so powerful is that they update automatically as new news or company data arrives, so your view always stays relevant with the latest earnings or industry announcements.
For example, some Redwire investors have adopted a bullish narrative, projecting an $887 million revenue run rate and a price target of $28 per share based on high space and defense spending. Others see risk from government contract volatility and set a much lower value around $10, proving that Narratives flexibly reflect any investor’s outlook and assumptions.
Do you think there's more to the story for Redwire? Create your own Narrative to let the Community know!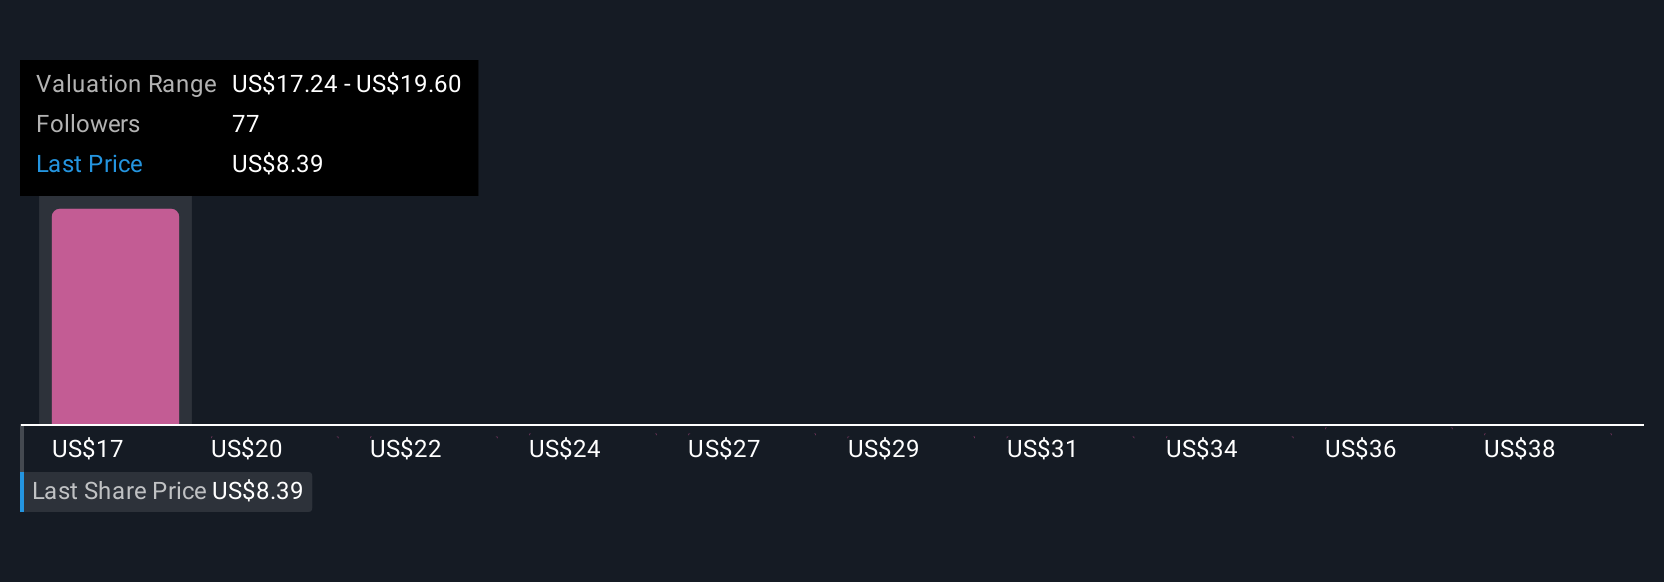
This article by Simply Wall St is general in nature. We provide commentary based on historical data and analyst forecasts only using an unbiased methodology and our articles are not intended to be financial advice. It does not constitute a recommendation to buy or sell any stock, and does not take account of your objectives, or your financial situation. We aim to bring you long-term focused analysis driven by fundamental data. Note that our analysis may not factor in the latest price-sensitive company announcements or qualitative material. Simply Wall St has no position in any stocks mentioned.