Why Baldwin Insurance Group (BWIN) Is Down 8.2% After Q1 Revenue Jump But Profit Slide
The Baldwin Group BWIN | 0.00 |
- In the first quarter of 2026, Baldwin Insurance Group reported revenue of US$532.24 million, up from US$413.41 million a year earlier, while net income fell to US$2.34 million from US$13.94 million and diluted EPS from continuing operations eased to US$0.02 from US$0.20.
- Management attributed the revenue outperformance to contributions from recent acquisitions and early synergy capture, even as organic growth remained muted and profitability compressed.
- We’ll now explore how this acquisition-led revenue beat, alongside early integration synergies, may influence Baldwin Insurance Group’s existing investment narrative.
This technology could replace computers: discover 26 stocks that are working to make quantum computing a reality.
Baldwin Insurance Group Investment Narrative Recap
To own Baldwin Insurance Group, you have to believe that its acquisition-heavy model, embedded partnerships and technology investments can eventually convert strong top-line growth into consistent profitability. The latest quarter reinforces that tension: revenue surged on recent deals and early synergies, but net income and EPS compressed, keeping earnings quality as the key short term catalyst and leverage, in a higher rate setting, as the most immediate risk. On balance, this news meaningfully sharpens focus on margins rather than growth.
Against that backdrop, the newly announced US$250.0 million share repurchase program is the standout recent development. It sits alongside elevated leverage and acquisition spending, and may influence how investors weigh capital allocation against the need to strengthen the balance sheet. In light of Q1’s acquisition-fueled revenue beat but thin profitability, the buyback authorization raises fresh questions about how much cash flexibility Baldwin really has if conditions tighten further.
Yet even as acquisitions lift revenue, investors should be aware that Baldwin’s elevated leverage and thinner margins could become far more important if...
Baldwin Insurance Group's narrative projects $2.5 billion revenue and $11.0 million earnings by 2029. This requires 17.7% yearly revenue growth and a $44.8 million earnings increase from -$33.8 million today.
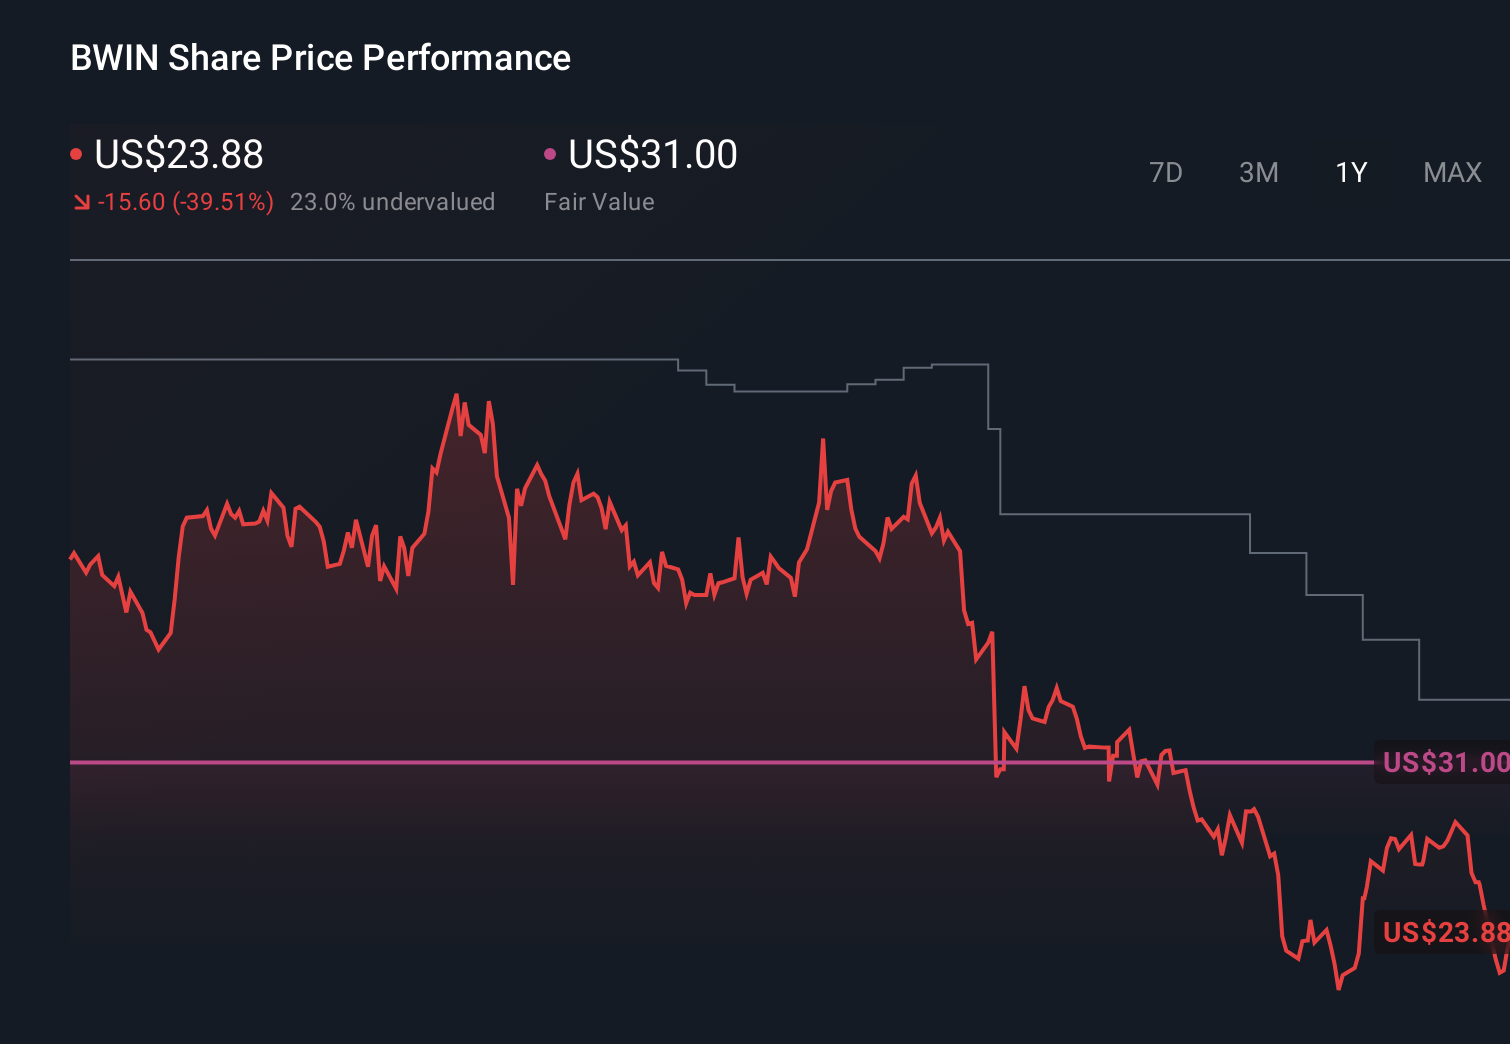
Uncover how Baldwin Insurance Group's forecasts yield a $29.33 fair value, a 46% upside to its current price.
Exploring Other Perspectives
Lowest case analysts were already cautious, assuming only about 9.8 percent annual revenue growth and US$20.7 million earnings by 2028, so Q1’s weak profit adds weight to their concern that technology and digital competition might pressure margins more than the consensus expects.
Explore 2 other fair value estimates on Baldwin Insurance Group - why the stock might be worth just $21.00!
Decide For Yourself
Disagree with existing narratives? Extraordinary investment returns rarely come from following the herd, so go with your instincts.
- A great starting point for your Baldwin Insurance Group research is our analysis highlighting 1 key reward and 1 important warning sign that could impact your investment decision.
- Our free Baldwin Insurance Group research report provides a comprehensive fundamental analysis summarized in a single visual - the Snowflake - making it easy to evaluate Baldwin Insurance Group's overall financial health at a glance.
Contemplating Other Strategies?
Our daily scans reveal stocks with breakout potential. Don't miss this chance:
- Invest in the nuclear renaissance through our list of 91 elite nuclear energy infrastructure plays powering the global AI revolution.
- The latest GPUs need a type of rare earth metal called Dysprosium and there are only 33 companies in the world exploring or producing it. Find the list for free.
- We've uncovered the 12 dividend fortresses yielding 5%+ that don't just survive market storms, but thrive in them.
This article by Simply Wall St is general in nature. We provide commentary based on historical data and analyst forecasts only using an unbiased methodology and our articles are not intended to be financial advice. It does not constitute a recommendation to buy or sell any stock, and does not take account of your objectives, or your financial situation. We aim to bring you long-term focused analysis driven by fundamental data. Note that our analysis may not factor in the latest price-sensitive company announcements or qualitative material. Simply Wall St has no position in any stocks mentioned.