Why Blue Bird (BLBD) Is Up 17.7% After Raising 2026 Profit Guidance On Electric Bus Demand
Blue Bird Corporation BLBD | 58.63 | -0.20% |
- Blue Bird Corporation recently reported fiscal first‑quarter 2026 results, with sales rising to US$333.08 million and net income increasing to US$30.76 million, while reaffirming full‑year 2026 net revenue guidance of US$1.50 billion.
- The company also raised its full‑year adjusted EBITDA guidance after record first‑quarter profitability and a sharply higher order backlog, underpinned by growing demand for alternative‑power and electric school buses.
- Next, we’ll examine how the raised profit outlook, supported by strong electric bus orders, shapes Blue Bird’s broader investment narrative.
Find 53 companies with promising cash flow potential yet trading below their fair value.
What Is Blue Bird's Investment Narrative?
To own Blue Bird today, you really need to believe that its niche in school buses, especially alternative‑power and electric models, can keep supporting solid, profitable operations rather than just one strong quarter. The latest Q1 FY2026 report, with sales of US$333.08 million, higher net income, and a guidance raise for full‑year adjusted EBITDA, reinforces that story by tying profit momentum directly to a 45% jump in orders and a sizeable backlog, including more than 850 electric buses. That is a clear positive for near‑term catalysts like margin resilience, capital returns via the US$100 million buyback, and management’s US$2 billion long‑term revenue ambition. At the same time, the recent share price surge and slower expected revenue and earnings growth than the wider US market keep execution, valuation, tariffs and input costs squarely in focus as key risks. Yet beneath the strong backlog and higher profit outlook lies one risk many investors might be underestimating.
Blue Bird's shares have been on the rise but are still potentially undervalued by 40%. Find out what it's worth.Exploring Other Perspectives
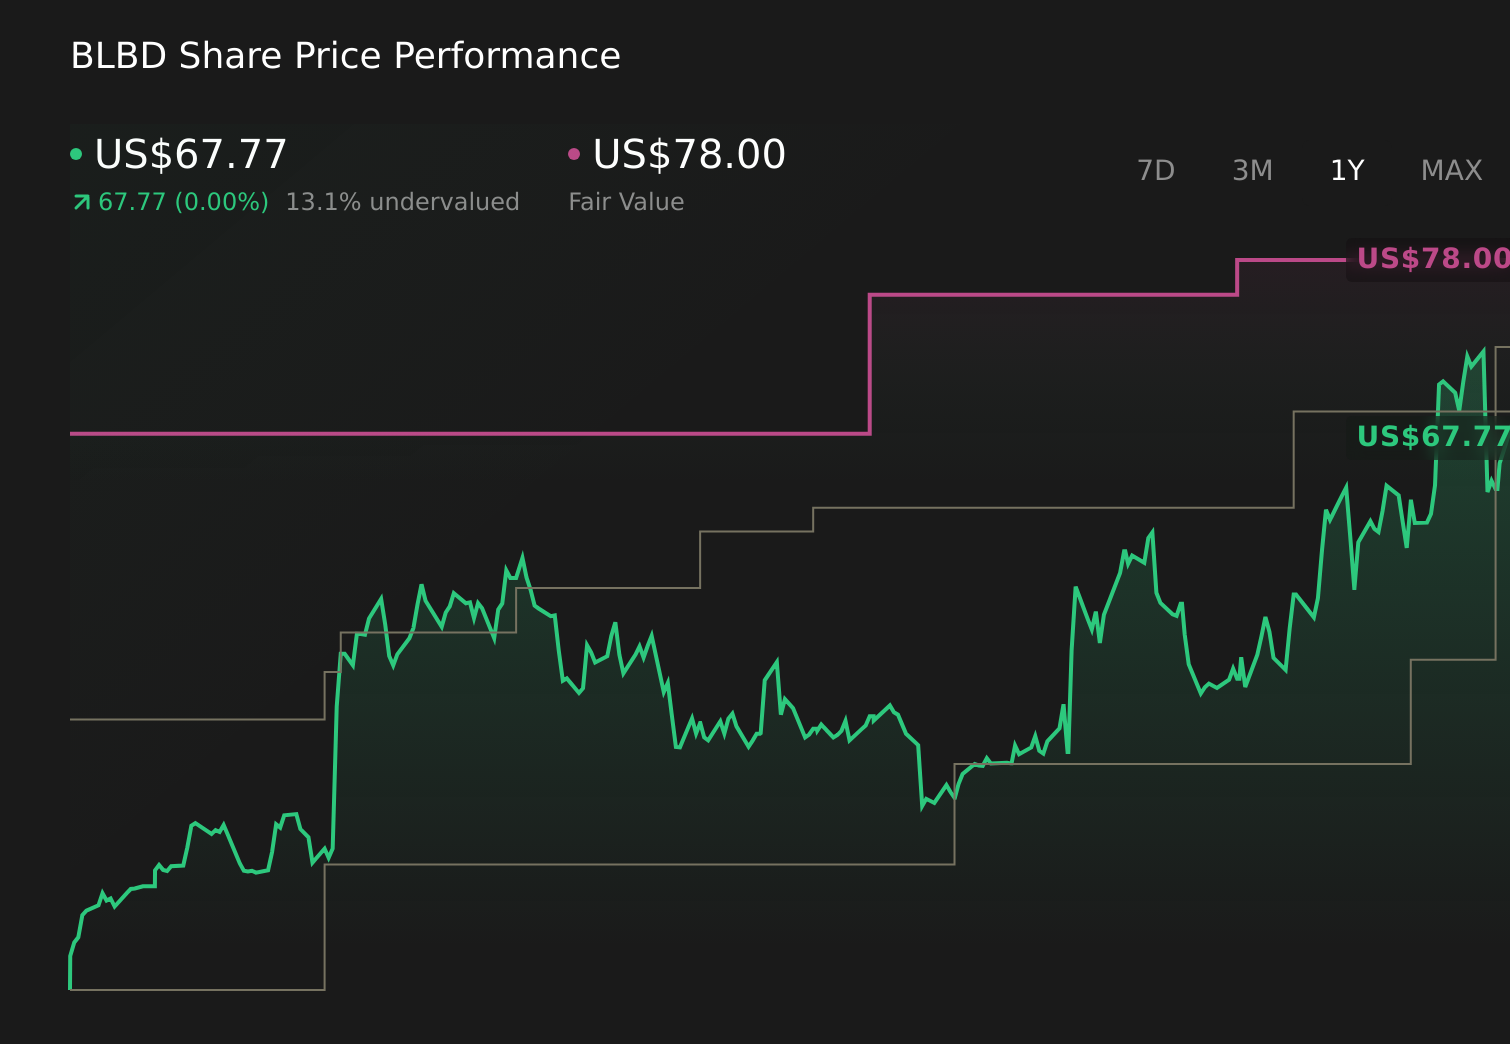
Three Simply Wall St Community fair value views, from US$63.75 to about US$98.34, show how differently individual investors are thinking about Blue Bird. Set those expectations against the recent earnings beat, raised EBITDA guidance and sharp share price move, and it becomes clear that understanding both the upside from electric bus demand and the risks from slower forecast growth is crucial before you commit fresh capital.
Explore 3 other fair value estimates on Blue Bird - why the stock might be worth just $63.75!
Build Your Own Blue Bird Narrative
Disagree with this assessment? Create your own narrative in under 3 minutes - extraordinary investment returns rarely come from following the herd.
- A great starting point for your Blue Bird research is our analysis highlighting 4 key rewards and 1 important warning sign that could impact your investment decision.
- Our free Blue Bird research report provides a comprehensive fundamental analysis summarized in a single visual - the Snowflake - making it easy to evaluate Blue Bird's overall financial health at a glance.
Ready To Venture Into Other Investment Styles?
Our daily scans reveal stocks with breakout potential. Don't miss this chance:
- Outshine the giants: these 30 early-stage AI stocks could fund your retirement.
- The future of work is here. Discover the 28 top robotics and automation stocks leading the charge in AI-driven automation and industrial transformation.
- Invest in the nuclear renaissance through our list of 87 elite nuclear energy infrastructure plays powering the global AI revolution.
This article by Simply Wall St is general in nature. We provide commentary based on historical data and analyst forecasts only using an unbiased methodology and our articles are not intended to be financial advice. It does not constitute a recommendation to buy or sell any stock, and does not take account of your objectives, or your financial situation. We aim to bring you long-term focused analysis driven by fundamental data. Note that our analysis may not factor in the latest price-sensitive company announcements or qualitative material. Simply Wall St has no position in any stocks mentioned.