Why I Sometimes Tell Myself Average Returns Are A Mirage
I got an early copy of Ben Carlson's new book, "Risk & Reward." It's terrific. (And it goes on sale May 12!)
Carlson, of Ritholtz Wealth Management, has a gift for being both entertaining and informative. His accessible writing makes for a casual read, and yet with each page you turn, you get a little smarter about investing.
His book is loaded with helpful charts and graphics. Chapter 14 has one of my favorite visualizations of stock market performance: It's a plot of the S&P 500's annual returns since 1928. It's pretty chaotic.
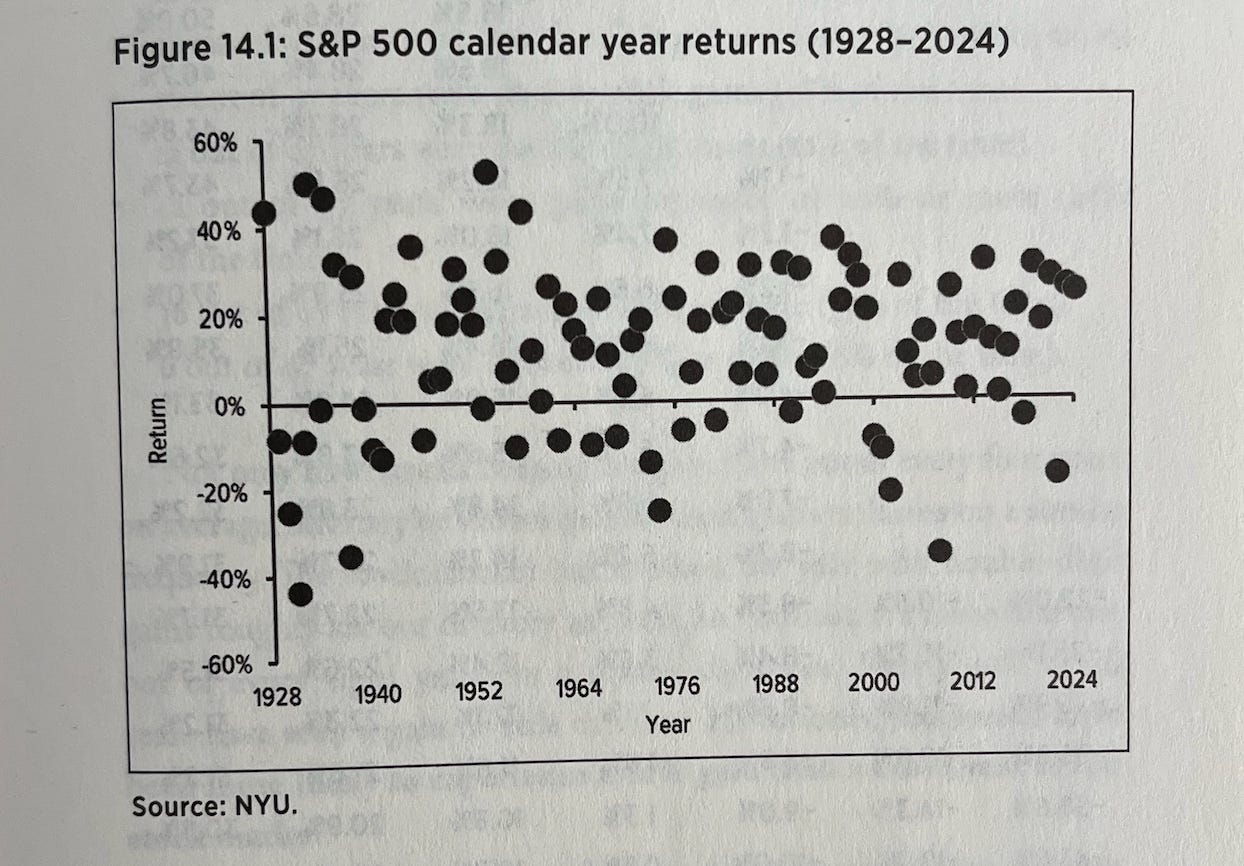
Some investors may find this scatterplot surprising, especially after hearing the near-constant refrain that the stock market typically returns 8% to 10%. And those figures are true if you average the years out. But almost none of the yearly returns line up in that range.
"Investing in the stock market would be far easier if you could simply bank on 10% each and every year," Carlson wrote. "Unfortunately, it doesn't work that way. … You could have periods of multiple down years in a row (like 1929 to 1932) or a cluster of positive years in a row (like 1995 to 1999). There are more gains than losses but no rhyme or reason when it comes to annual stock market returns."
As someone who's anxious and finds the investing process to be generally unpleasant, I'm constantly managing expectations. Sometimes, this means deprogramming flawed beliefs born out of faulty assumptions.
One of the bigger flawed assumptions I had to correct was that an average return is something that happens frequently.
In fact, the opposite is true.
"One of the strangest aspects of stock market returns in any given year is how seldom they finish around the long-term average," Carlson added.
He reviews the history going back to 1928.
In the meantime, I'll point you to this visualization shared by Carlson's colleague Michael Batnick. It shows annual returns in the S&P 500 since 1950, sorted from highest to lowest. In red, you can see instances where the S&P returned 7% to 10%. There are just five.
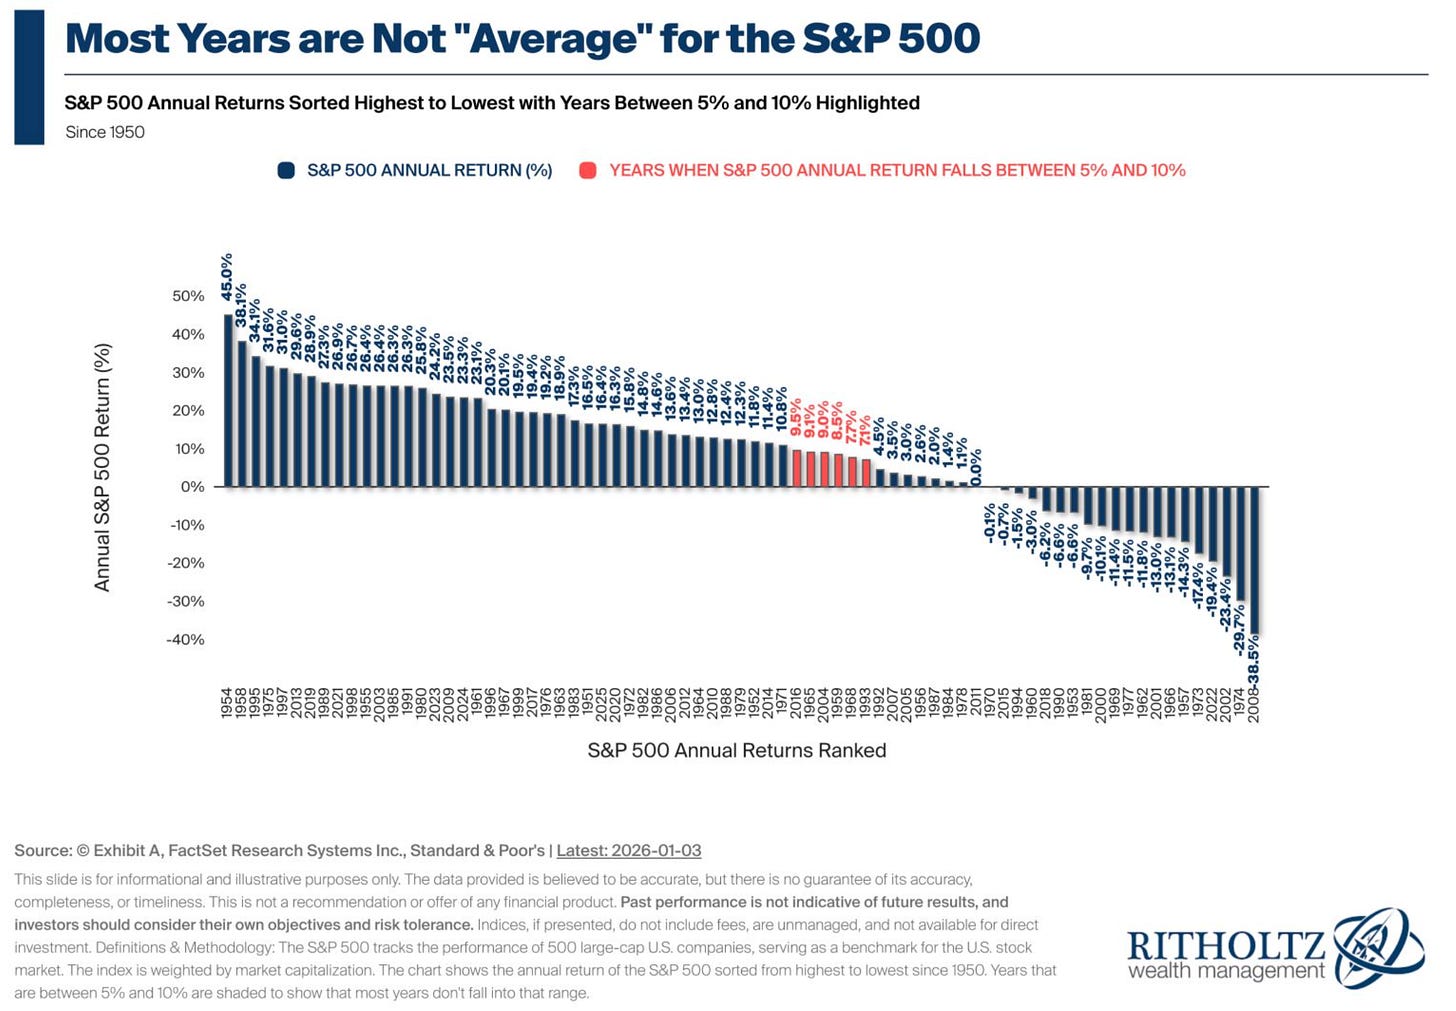
The lesson: An investor's long-term returns may reflect the averages we talk about. But that's only because they've experienced a combination of many very strong years, some lackluster years, some negative years, and a very small handful of average years.
Average years are so rare that you might as well treat them like a mirage. Just because you can see them in the math doesn't mean that they're likely to be ahead of you in the coming year. Manage your expectations.
That said, as years pass, I think it's a good exercise to see long-term performance in terms of annualized averages. You may be in the middle of a very strong year or an unusually negative one. But in the context of the past several years, you're likely to see something that's a little more average.
Benzinga Disclaimer: This article is from an unpaid external contributor. It does not represent Benzinga’s reporting and has not been edited for content or accuracy.