

Why Nelnet (NNI) Is Getting Attention Today
Nelnet, Inc. Class A NNI | 0.00 |
Nelnet (NNI) is in focus after reporting second quarter 2026 results that showed net income of US$66.66 million and basic earnings per share of US$1.85, both lower than the same period last year.
The weaker second quarter results have coincided with softer recent trading in Nelnet, with the share price down 6.29% over the past month and 2.45% year to date. However, the 5 year total shareholder return of 69.80% still reflects a much stronger longer term outcome.
If Nelnet’s mixed performance has you reassessing opportunities, this could be a good moment to look beyond a single stock and check out 21 top founder-led companies
Nenlet’s weaker earnings and recent share price slip put the spotlight on what is already reflected in the US$125.83 valuation. Is most of the upside already priced in, or is there still meaningful room ahead based on fundamentals?
Price-to-Earnings of 14.9x: Is it justified?
On a P/E of 14.9x and a last close of $125.83, Nelnet looks expensive compared to its Consumer Finance peers, yet it trades on a lower multiple than the wider US market.
The P/E ratio compares the share price to earnings per share and gives a quick read on how much investors are paying for each dollar of current profit. For a company like Nelnet, which operates across loan servicing, education technology services, payments and asset management, earnings quality, growth trends and capital intensity all matter when thinking about what multiple makes sense.
Here, the signals are mixed. Nelnet’s earnings have declined by around 10.6% per year over the past 5 years and fell again over the past year. Net profit margins have softened from 21.1% to 20.3%. At the same time, the P/E of 14.9x is higher than the US Consumer Finance industry average of 9.9x and above the 11.3x peer average. That suggests investors are paying a premium relative to direct peers despite weaker historic earnings trends and a Return on Equity of 6.6%.
With no fair P/E ratio reference available from the SWS model, there is no regression based anchor for where this multiple might trend over time compared to similar businesses.
Result: Price-to-Earnings of 14.9x (OVERVALUED)
However, Nelnet still faces risks if earnings weakness persists or if any slowdown across loan servicing or education technology and payments puts pressure on profitability at today’s valuation.
Another view on Nelnet’s value using cash flows
The P/E discussion suggests Nelnet looks expensive, and the SWS DCF model points to an even starker picture. On this view, the current price of $125.83 sits well above an estimated future cash flow value of $20.61. That implies limited margin for error if cash generation disappoints.
For investors, the question is whether the market is correctly looking past those cash flow assumptions, or whether this gap is a warning sign that deserves more attention.
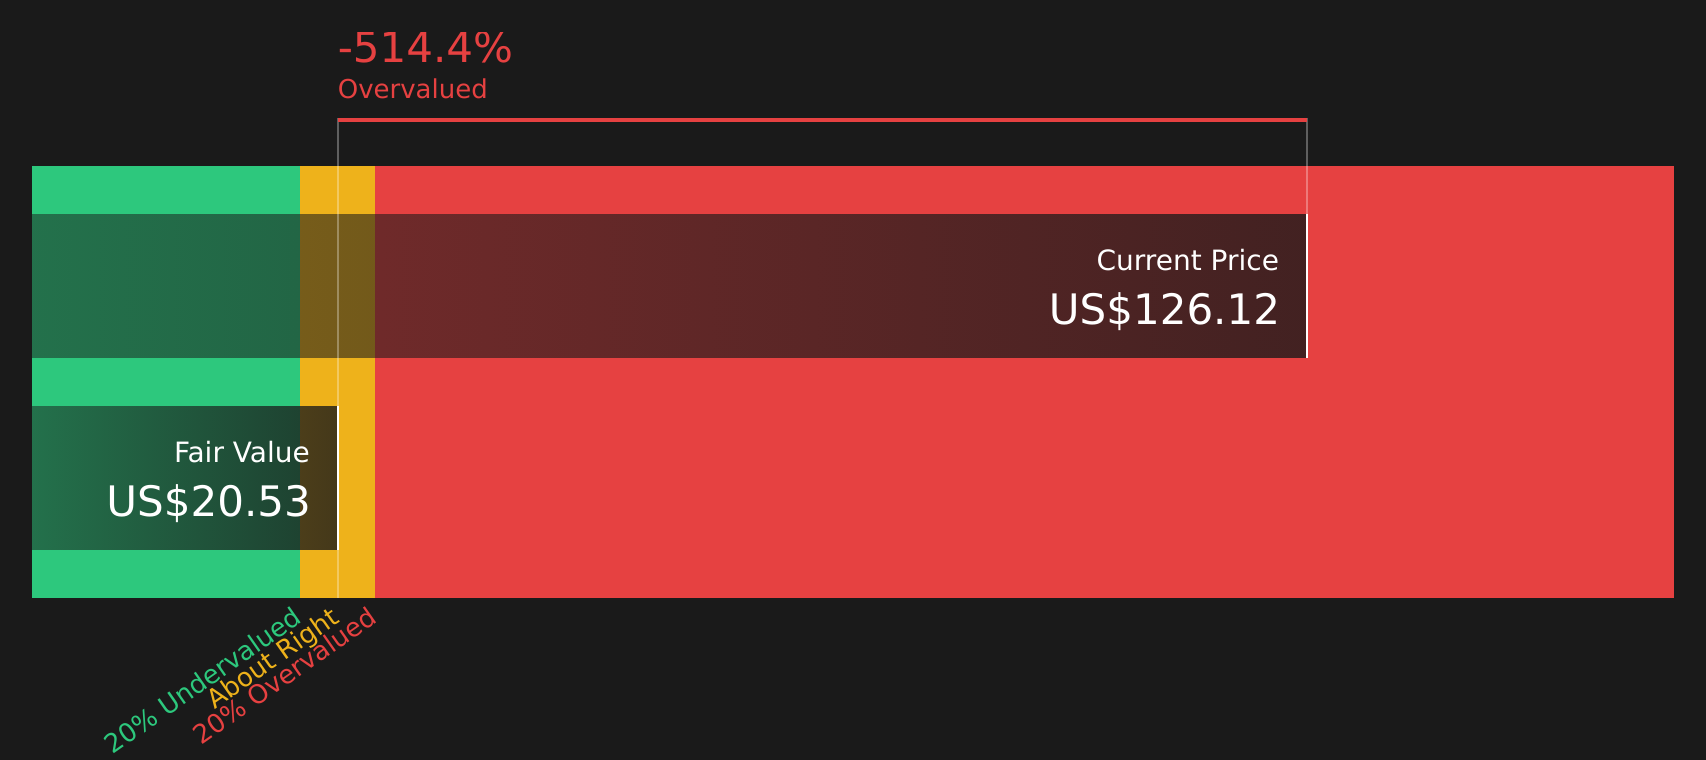
Simply Wall St performs a discounted cash flow (DCF) on every stock in the world every day (check out Nelnet for example). We show the entire calculation in full. You can track the result in your watchlist or portfolio and be alerted when this changes, or use our stock screener to discover 53 high quality undervalued stocks. If you save a screener we even alert you when new companies match - so you never miss a potential opportunity.
Next Steps
With mixed signals around Nelnet’s earnings, valuation and outlook, it makes sense to review the full picture yourself and move quickly while sentiment is divided. To weigh up both sides in one place, take a close look at the 1 key reward and 2 important warning signs
Looking for more investment ideas beyond Nelnet?
If you want to keep momentum after reviewing Nelnet, use the Simply Wall St Screener to surface other opportunities that fit your style and risk tolerance.
- Spot potential bargains by reviewing companies that appear mispriced on fundamentals with the 53 high quality undervalued stocks.
- Prioritise resilience and sleep easier at night by focusing on companies in the 80 resilient stocks with low risk scores.
- Hunt for future front runners that the market may be overlooking through the screener containing 19 high quality undiscovered gems.
This article by Simply Wall St is general in nature. We provide commentary based on historical data and analyst forecasts only using an unbiased methodology and our articles are not intended to be financial advice. It does not constitute a recommendation to buy or sell any stock, and does not take account of your objectives, or your financial situation. We aim to bring you long-term focused analysis driven by fundamental data. Note that our analysis may not factor in the latest price-sensitive company announcements or qualitative material. Simply Wall St has no position in any stocks mentioned.