Why Precigen (PGEN) Is Down 11.5% After Mixed Quarterly Results And What's Next
Precigen Inc PGEN | 3.25 3.24 | -11.44% -0.31% Pre |
- In the past few days, Precigen reported quarterly results that surprised on revenue but fell short on earnings per share expectations, drawing fresh attention to its gene and cell therapy pipeline.
- An interesting angle is that analysts remain focused on anticipated revenue expansion despite the earnings miss, suggesting the top-line trajectory is central to how the company is being evaluated.
- We’ll now examine how this revenue surprise alongside an earnings miss may reshape Precigen’s investment narrative and future expectations.
Invest in the nuclear renaissance through our list of 85 elite nuclear energy infrastructure plays powering the global AI revolution.
Precigen Investment Narrative Recap
To own Precigen, you need to believe PAPZIMEOS can scale from a first-in-class therapy for adult RRP into a meaningful commercial franchise, while the broader gene and cell therapy pipeline adds long term optionality. The latest quarter’s revenue surprise, paired with an EPS miss, does not materially change the near term focus on PAPZIMEOS launch execution as the key catalyst or the company’s funding and dilution risk as the central concern.
In that context, the recent expert consensus paper endorsing PAPZIMEOS as first line standard of care for adults with recurrent respiratory papillomatosis looks especially relevant, as it reinforces the product’s clinical positioning just as investors are scrutinizing reported revenue momentum. How quickly this endorsement translates into treated patient growth and payer supported access will be important for assessing both the sustainability of the revenue trend and the timing of any progress toward cash flow breakeven.
Yet while top line surprises grab attention, investors also need to be aware of the risk that slower than expected PAPZIMEOS uptake could...
Precigen’s narrative projects $299.5 million revenue and $118.4 million earnings by 2028. This requires 262.1% yearly revenue growth and a $544.3 million earnings increase from $-425.9 million today.
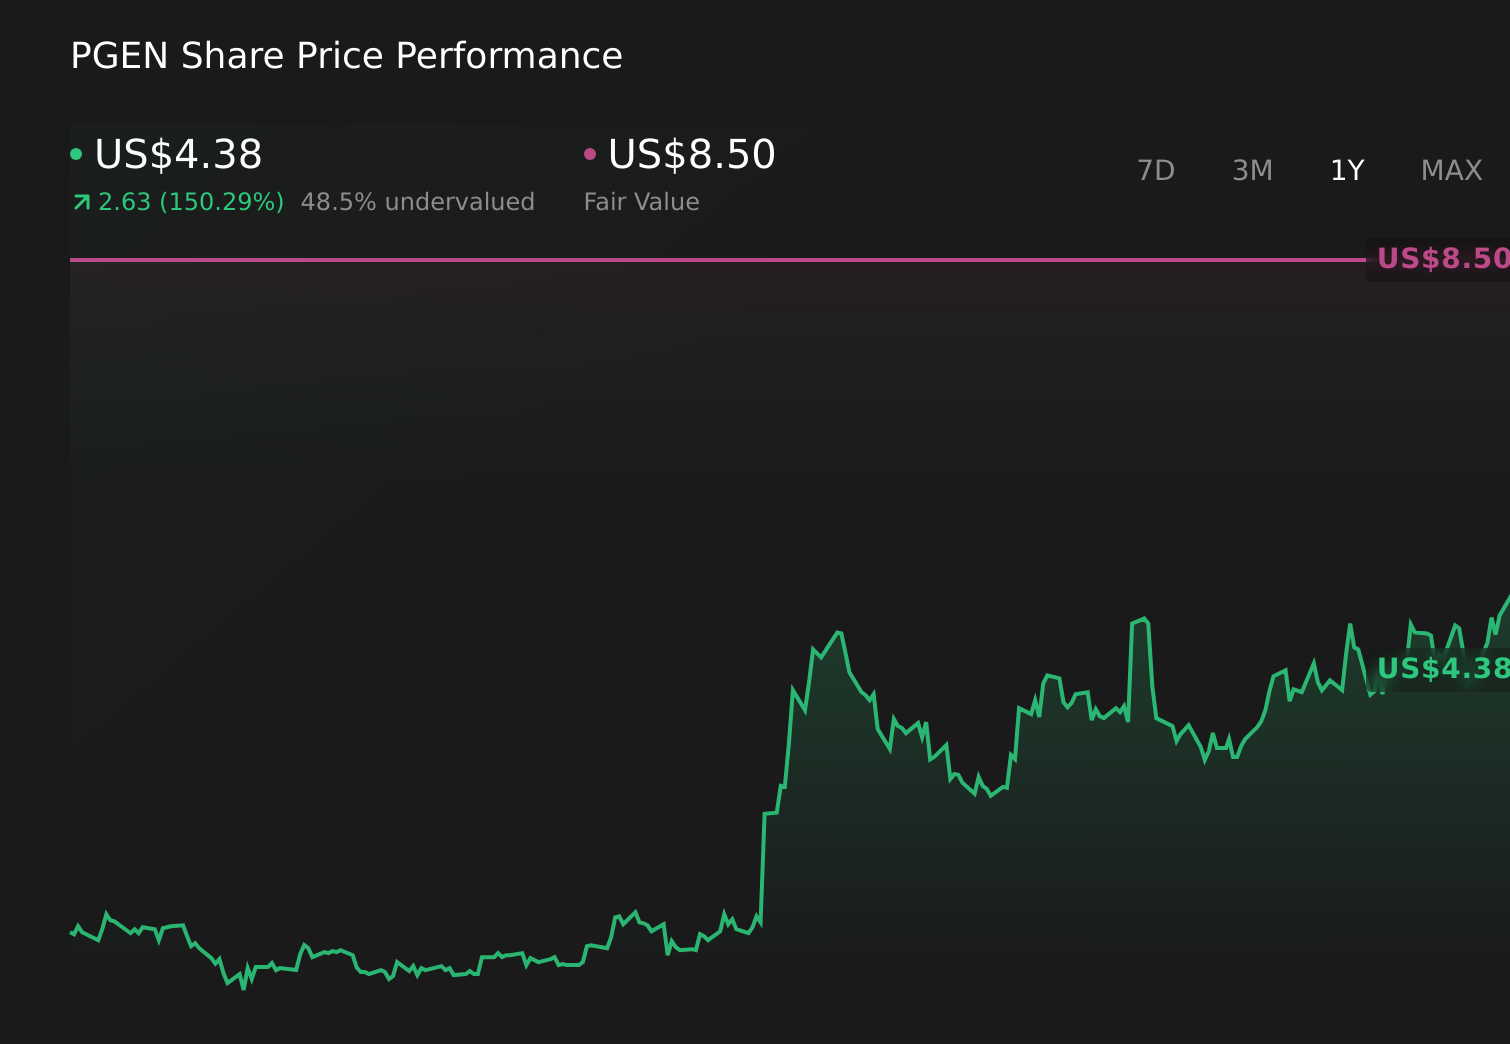
Uncover how Precigen's forecasts yield a $8.50 fair value, a 152% upside to its current price.
Exploring Other Perspectives
Eleven fair value estimates from the Simply Wall St Community span roughly US$0.50 to US$25.30 per share, showing how far apart views on Precigen can be. When you set that against the dependence on PAPZIMEOS launch momentum and the risk that slower patient uptake could keep fixed costs elevated for longer, it underlines why many market participants are weighing several very different scenarios for the company’s future performance.
Explore 11 other fair value estimates on Precigen - why the stock might be worth less than half the current price!
The Verdict Is Yours
Disagree with existing narratives? Extraordinary investment returns rarely come from following the herd, so go with your instincts.
- A great starting point for your Precigen research is our analysis highlighting 1 key reward and 2 important warning signs that could impact your investment decision.
- Our free Precigen research report provides a comprehensive fundamental analysis summarized in a single visual - the Snowflake - making it easy to evaluate Precigen's overall financial health at a glance.
Curious About Other Options?
Markets shift fast. These stocks won't stay hidden for long. Get the list while it matters:
- Rare earth metals are the new gold rush. Find out which 29 stocks are leading the charge.
- We've uncovered the 14 dividend fortresses yielding 5%+ that don't just survive market storms, but thrive in them.
- AI is about to change healthcare. These 32 stocks are working on everything from early diagnostics to drug discovery. The best part - they are all under $10b in market cap - there's still time to get in early.
This article by Simply Wall St is general in nature. We provide commentary based on historical data and analyst forecasts only using an unbiased methodology and our articles are not intended to be financial advice. It does not constitute a recommendation to buy or sell any stock, and does not take account of your objectives, or your financial situation. We aim to bring you long-term focused analysis driven by fundamental data. Note that our analysis may not factor in the latest price-sensitive company announcements or qualitative material. Simply Wall St has no position in any stocks mentioned.