Why Weatherford International (WFRD) Is Up 12.1% After Q4 Beat, Dividend Hike And Buyback Completion
Weatherford International plc Ordinary Shares - New WFRD | 96.35 96.35 | +1.53% 0.00% Post |
- Weatherford International’s fourth-quarter 2025 results, released on 3 February 2026, showed revenue of US$1,289 million and net income of US$138 million, beating analyst earnings expectations and supported by a 10% dividend increase to US$0.275 per share.
- Alongside the earnings beat, the company completed a US$200.01 million buyback program and secured multi‑year contracts across the Middle East and Latin America, underscoring management’s focus on capital returns and contract visibility.
- We’ll now examine how the earnings beat and higher dividend reshape Weatherford International’s investment narrative over the coming quarters.
Invest in the nuclear renaissance through our list of 87 elite nuclear energy infrastructure plays powering the global AI revolution.
What Is Weatherford International's Investment Narrative?
To own Weatherford International today, you need to believe in a disciplined oilfield services business that can convert a steadier revenue base into consistent cash generation, even if top line growth moderates. The latest quarter fits that story: Q4 2025 earnings and margins came in ahead of expectations, the quarterly dividend was lifted 10% to US$0.275 per share, and the company finished a US$200.01 million buyback, all while net leverage sat at about 0.42 times with US$1.6 billion of liquidity. Those moves slightly strengthen the near term equity case by reinforcing capital return and balance sheet strength just as new multi year contracts in the Middle East and Latin America support revenue visibility. The key risk is that softer activity in early 2026, alongside relatively full valuation metrics, could pressure sentiment if execution wobbles.
However, investors also need to consider how early‑2026 softness could test this capital return story. Weatherford International's shares have been on the rise but are still potentially undervalued. Find out how large the opportunity might be.Exploring Other Perspectives
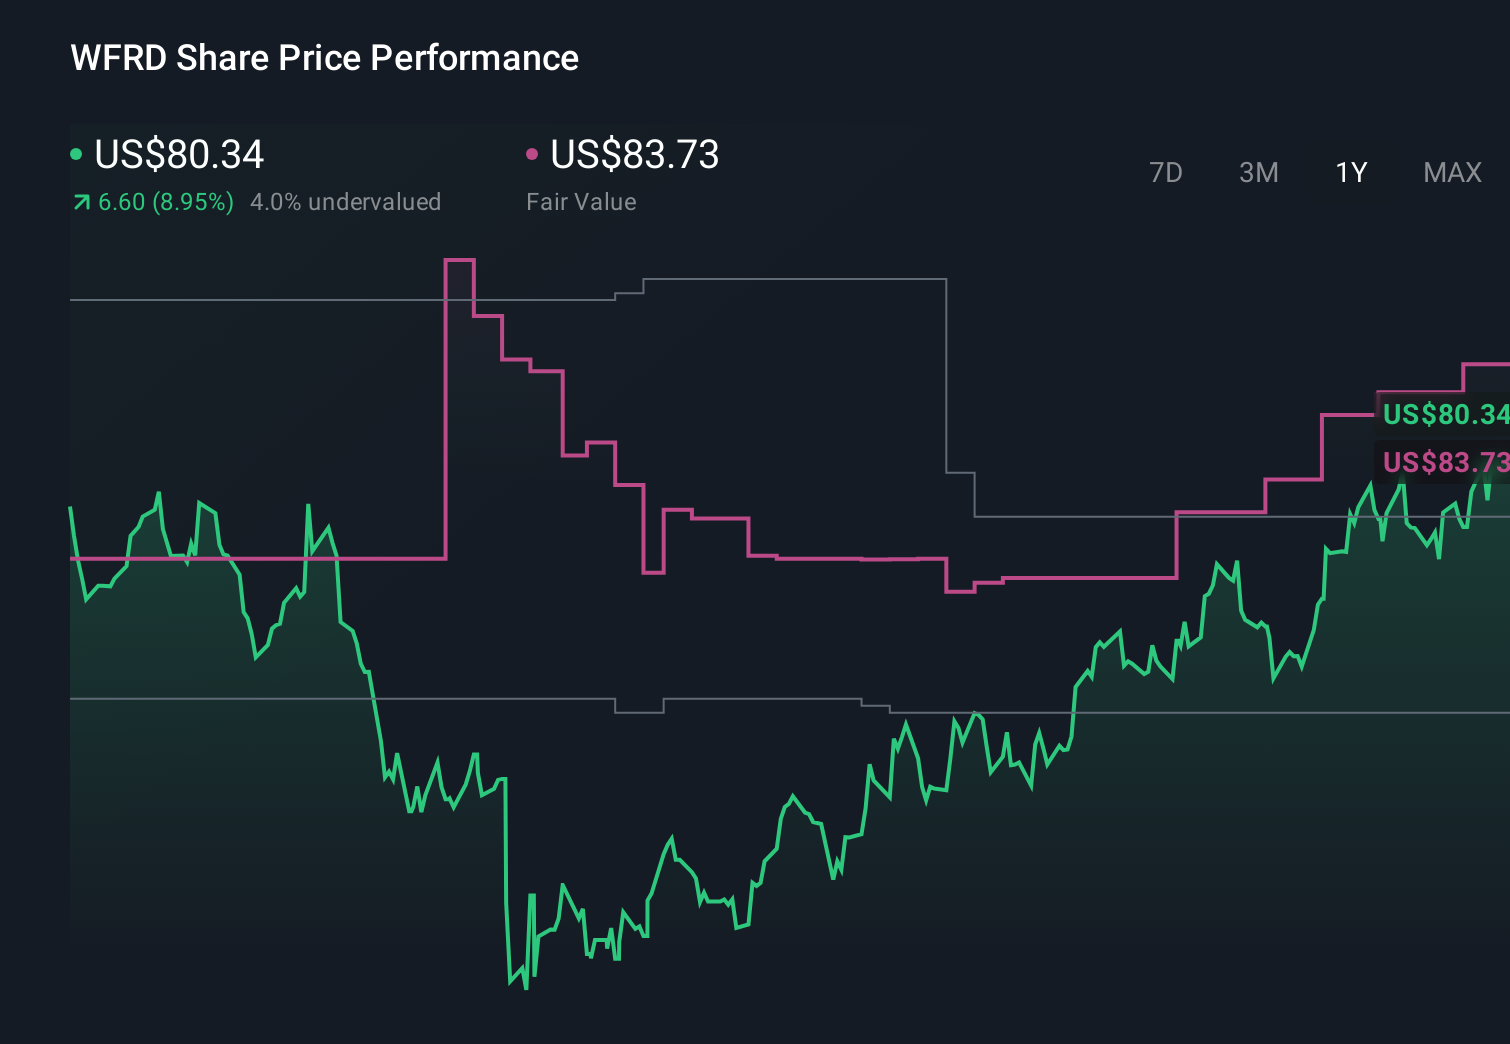
Five Simply Wall St Community fair value estimates for Weatherford span roughly US$73 to US$312.92, reflecting very different expectations. Set against recent earnings strength, buybacks and a higher dividend, that spread underlines how differently investors can weigh contract wins against near term activity risks and makes a broad set of viewpoints especially useful.
Explore 5 other fair value estimates on Weatherford International - why the stock might be worth 31% less than the current price!
Build Your Own Weatherford International Narrative
Disagree with this assessment? Create your own narrative in under 3 minutes - extraordinary investment returns rarely come from following the herd.
- A great starting point for your Weatherford International research is our analysis highlighting 2 key rewards that could impact your investment decision.
- Our free Weatherford International research report provides a comprehensive fundamental analysis summarized in a single visual - the Snowflake - making it easy to evaluate Weatherford International's overall financial health at a glance.
Looking For Alternative Opportunities?
Every day counts. These free picks are already gaining attention. See them before the crowd does:
- Capitalize on the AI infrastructure supercycle with our selection of the 33 best 'picks and shovels' of the AI gold rush converting record-breaking demand into massive cash flow.
- Find 53 companies with promising cash flow potential yet trading below their fair value.
- Rare earth metals are the new gold rush. Find out which 29 stocks are leading the charge.
This article by Simply Wall St is general in nature. We provide commentary based on historical data and analyst forecasts only using an unbiased methodology and our articles are not intended to be financial advice. It does not constitute a recommendation to buy or sell any stock, and does not take account of your objectives, or your financial situation. We aim to bring you long-term focused analysis driven by fundamental data. Note that our analysis may not factor in the latest price-sensitive company announcements or qualitative material. Simply Wall St has no position in any stocks mentioned.