Will Chubb’s (CB) Bigger Buyback and Higher Dividend Redefine Its Capital Return Narrative?
Chubb Limited CB | 0.00 |
- In recent days, Chubb Limited announced a 5.2% dividend increase, its 33rd consecutive annual raise, and approved a new US$7.50 billion share repurchase program, reinforcing its ongoing capital return plans to shareholders.
- This combination of higher dividends and a sizable buyback authorization highlights Chubb’s confidence in its earnings power and disciplined balance sheet management, even as loss costs and catastrophe risks remain key variables.
- Next, we’ll examine how Chubb’s larger buyback authorization may reshape its investment narrative and the outlook for future shareholder returns.
We've uncovered the 9 dividend fortresses yielding 5%+ that don't just survive market storms, but thrive in them.
Chubb Investment Narrative Recap
To own Chubb, you generally need to believe in disciplined underwriting, careful catastrophe exposure management, and a consistent capital return framework. The new 5.2% dividend increase and US$7.50 billion buyback authorization do not materially change the near term earnings catalyst, but they sit alongside the key risk that higher loss costs, catastrophe events, or litigation trends could pressure profitability more than expected.
The newly authorized US$7.50 billion share repurchase program is the clearest link to the current story, given investors are already focused on capital deployment and recent buyback activity. While this plan can support per share metrics if executed, it does not remove the underlying exposure to social inflation, catastrophe losses, and pricing pressure in competitive property and large account markets, which remain central to the near term outlook.
But even with accelerating buybacks and dividend growth, investors should still be aware of how rising social inflation could...
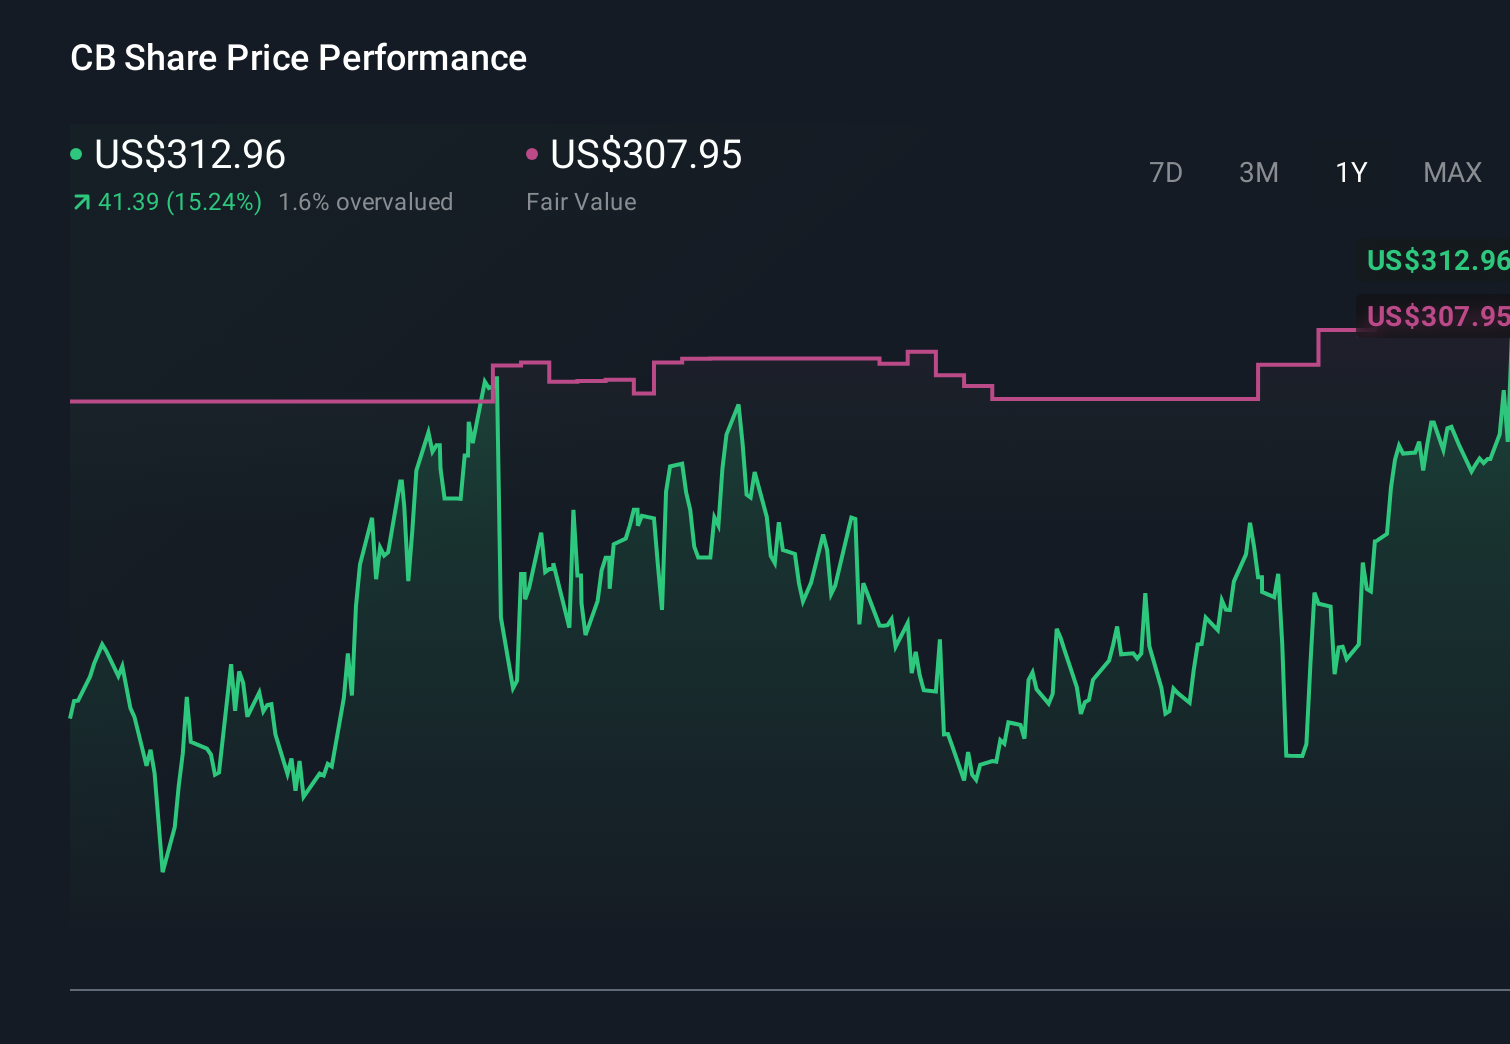
Chubb’s narrative projects $50.1 billion revenue and $10.9 billion earnings by 2029. This implies a 6.4% yearly revenue decline and an earnings decrease of $0.4 billion from $11.3 billion today.
Uncover how Chubb's forecasts yield a $345.78 fair value, a 6% upside to its current price.
Exploring Other Perspectives
Two fair value estimates from the Simply Wall St Community span roughly US$345 to US$667 per share, underscoring how far apart individual views can be. When you weigh those opinions against Chubb’s exposure to rising loss costs and catastrophe risk, it becomes even more important to explore several alternative viewpoints on how those pressures might shape future performance.
Explore 2 other fair value estimates on Chubb - why the stock might be worth over 2x more than the current price!
Form Your Own Verdict
Don't just follow the ticker - dig into the data and build a conviction that's truly your own.
- A great starting point for your Chubb research is our analysis highlighting 2 key rewards and 2 important warning signs that could impact your investment decision.
- Our free Chubb research report provides a comprehensive fundamental analysis summarized in a single visual - the Snowflake - making it easy to evaluate Chubb's overall financial health at a glance.
Ready For A Different Approach?
Right now could be the best entry point. These picks are fresh from our daily scans. Don't delay:
- Outshine the giants: these 14 early-stage AI stocks could fund your retirement.
- Uncover the next big thing with 24 elite penny stocks that balance risk and reward.
- Invest in the nuclear renaissance through our list of 88 elite nuclear energy infrastructure plays powering the global AI revolution.
This article by Simply Wall St is general in nature. We provide commentary based on historical data and analyst forecasts only using an unbiased methodology and our articles are not intended to be financial advice. It does not constitute a recommendation to buy or sell any stock, and does not take account of your objectives, or your financial situation. We aim to bring you long-term focused analysis driven by fundamental data. Note that our analysis may not factor in the latest price-sensitive company announcements or qualitative material. Simply Wall St has no position in any stocks mentioned.