

W.W. Grainger (GWW) Lifts Guidance After Earnings, Is The Stock Fully Valued?
W.W. Grainger, Inc. GWW | 0.00 |
W.W. Grainger earnings and guidance move into focus
W.W. Grainger (GWW) is in the spotlight after reporting second quarter 2026 results and updating its outlook, combining higher sales and earnings with guidance for slightly lower operating margins next quarter.
At a share price of $1,321.38, W.W. Grainger has a 7 day share price return of 3.03% but a 30 day share price return that is down 3.62%, while the 1 year total shareholder return of 36.71% and 5 year total shareholder return of 223.16% point to strong longer term momentum.
If this mix of earnings news and guidance has you thinking about where else growth and resilience might show up next, it could be a good moment to scan 35 power grid technology and infrastructure stocks
W.W. Grainger shares now sit near recent highs after strong quarterly results, but with guidance that points to slightly softer margins ahead. Does that risk and reward balance still lean toward buyers at this price, or not?
Price-to-Earnings of 33.3x for W.W. Grainger: Is it justified?
On a P/E of 33.3x against a last close of $1,321.38, W.W. Grainger trades at a richer earnings multiple than both its industry and peer group.
The P/E ratio compares the company’s share price to its earnings per share. For a mature distributor like W.W. Grainger, a higher P/E often reflects the market’s willingness to pay more for each dollar of current and expected earnings, which can tie back to its long track record, scale advantages and perceived resilience of its cash flows.
Here the market is assigning W.W. Grainger a premium. The P/E of 33.3x sits above the US Trade Distributors industry average of 26.6x and also above the peer average of 29.8x. It is also higher than the estimated fair P/E of 29x, a level that suggests where the ratio could gravitate toward if pricing lined up more closely with that fair benchmark.
Result: Price-to-Earnings of 33.3x (OVERVALUED)
However, W.W. Grainger still faces risks if margin pressure from its Endless Assortment segment persists or if maintenance and repair spending from key customers slows.
Another view on W.W. Grainger valuation
While the P/E of 33.3x suggests W.W. Grainger is priced richly, the SWS DCF model points in the same direction. At a share price of $1,321.38, the stock sits above the model’s future cash flow value estimate of $1,161.07, which implies limited valuation cushion if sentiment cools.
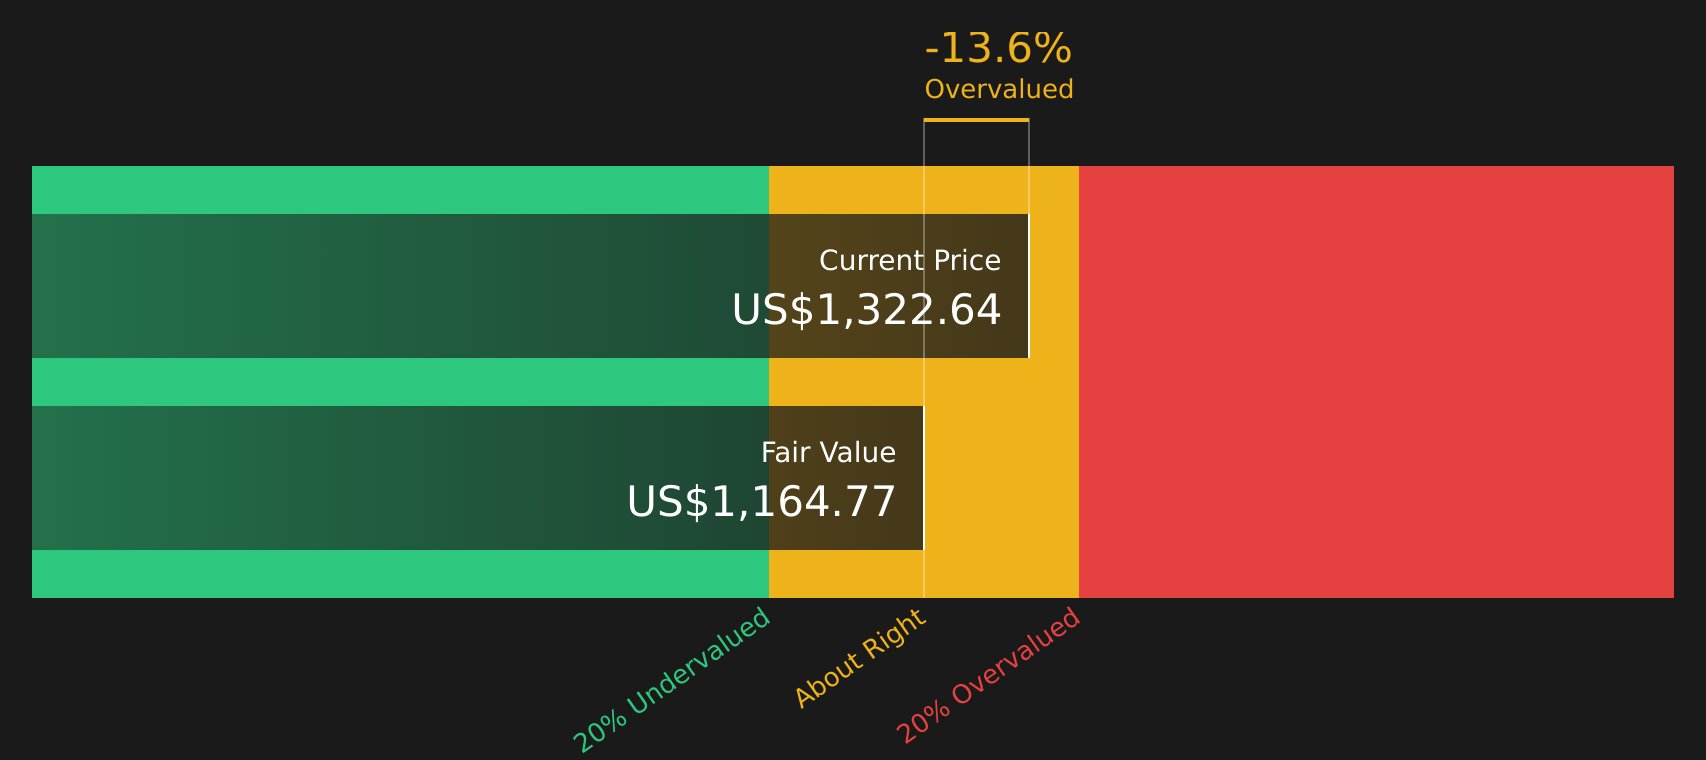
Simply Wall St performs a discounted cash flow (DCF) on every stock in the world every day (check out W.W. Grainger for example). We show the entire calculation in full. You can track the result in your watchlist or portfolio and be alerted when this changes, or use our stock screener to discover 51 high quality undervalued stocks. If you save a screener we even alert you when new companies match - so you never miss a potential opportunity.
Next Steps
If this mix of rich valuation and mixed guidance around W.W. Grainger leaves you undecided, do not wait to check the details for yourself. Use the 1 key reward and 1 important warning sign to weigh the concerns against the potential upside and shape your own conclusion.
Looking for more investment ideas beyond W.W. Grainger?
Do not stop with W.W. Grainger. Take a few minutes to scan other stocks with strong fundamentals and different risk profiles so you are not relying on a single idea.
- Target steadier growth by reviewing companies screened for consistent fundamentals and robust finances through the solid balance sheet and fundamentals stocks screener (49 results).
- Hunt for potential value opportunities by checking the 51 high quality undervalued stocks that combine quality metrics with pricing that may look comparatively attractive.
- Prioritise resilience and capital preservation by filtering for 88 resilient stocks with low risk scores that score well on balance sheet strength and downside risk indicators.
This article by Simply Wall St is general in nature. We provide commentary based on historical data and analyst forecasts only using an unbiased methodology and our articles are not intended to be financial advice. It does not constitute a recommendation to buy or sell any stock, and does not take account of your objectives, or your financial situation. We aim to bring you long-term focused analysis driven by fundamental data. Note that our analysis may not factor in the latest price-sensitive company announcements or qualitative material. Simply Wall St has no position in any stocks mentioned.