Xerox Holdings (XRX) Earnings Losses Reinforce Long Running Profit Decline Concerns
Xerox Holdings Corporation XRX | 1.26 | 0.00% |
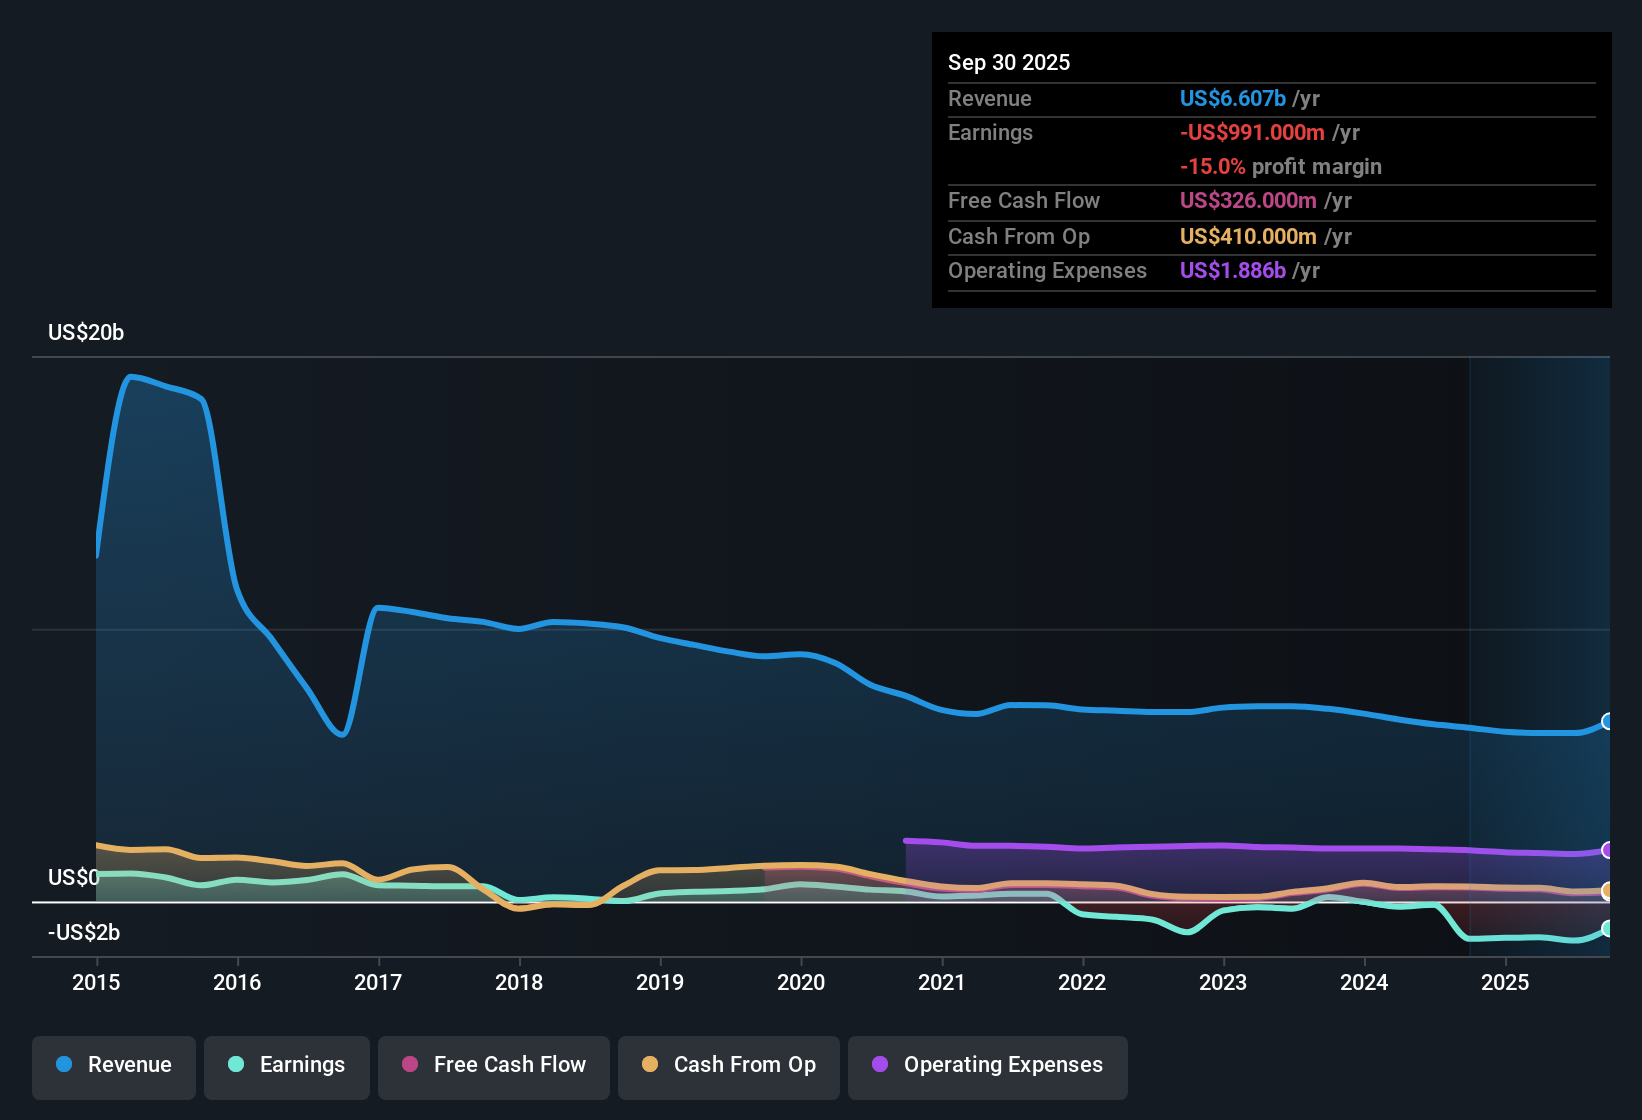
Xerox Holdings (XRX) closed out FY 2025 with Q4 revenue of US$2.0 billion and a basic EPS loss of US$0.60, alongside trailing twelve month EPS of US$8.25 in losses on US$7.0 billion of revenue. Over recent quarters, the company has seen revenue move from US$1.5 billion in Q3 2024 to US$2.0 billion in Q4 2025, while quarterly EPS swung between a loss of US$9.72 in Q3 2024 and a loss of US$0.60 in the latest period. This sets up a story in which margin pressure and loss-making results sit at the center of how investors may interpret this update.
See our full analysis for Xerox Holdings.With the headline numbers on the table, the next step is to see how this earnings profile lines up with the dominant narratives around Xerox, and where the data either backs those views or calls them into question.
Trailing losses and a 44.5% profit decline pace
- Over the past five years, Xerox’s profits declined at about 44.5% per year, and trailing twelve month net income shows a loss of US$1,043 million on US$7.0b of revenue.
- Bears focus on this long profit decline, and the trailing basic EPS loss of US$8.25 heavily supports that cautious view, while:
- Quarterly losses in FY 2025, from US$94 million in Q1 to US$76 million in Q4, underline that the business has not yet returned to profitability across the year.
- Net income over recent trailing periods stayed in a loss range above US$990 million, which backs concerns about earnings resilience.
Revenue at 5.4% growth, below 10.6% market pace
- Revenue over the trailing twelve months is described as growing at 5.4% per year to about US$7.0b, while the cited broader US market growth rate is 10.6% per year.
- What stands out for a more bullish narrative is that there is some reported revenue growth, yet:
- The 5.4% annual revenue growth pairs with a trailing net loss of US$1,043 million, so higher sales have not translated into positive earnings so far.
- Trailing basic EPS at a loss of US$8.25 contrasts with the idea of a clean revenue led improvement and keeps pressure on any bullish case that relies heavily on top line trends.
Debt pressure, 4.9% dividend, and low price versus DCF fair value
- The shares trade at US$2.04 against a DCF fair value of about US$6.89, while the company carries debt that is not well covered by operating cash flow and pays a 4.9% dividend that is not covered by earnings.
- Critics highlight that weak cash coverage of debt and an uncovered dividend are central bearish points, and the numbers back that concern even alongside cheap looking valuation signals:
- Trailing twelve month losses of US$1,043 million mean earnings do not fund the 4.9% yield, which challenges the idea of the payout as a steady income source.
- At the same time, the current price sitting about 70.4% below the cited DCF fair value and an inexpensive P/S relative to peers show why some investors still see potential value despite these balance sheet and payout pressures.
To see how other investors are weighing these earnings against the long term story, analysts and community members have pulled the numbers together into a single narrative for Xerox.
📊 Read the full Xerox Holdings Consensus Narrative.Next Steps
Don't just look at this quarter; the real story is in the long-term trend. We've done an in-depth analysis on Xerox Holdings's growth and its valuation to see if today's price is a bargain. Add the company to your watchlist or portfolio now so you don't miss the next big move.
See What Else Is Out There
Xerox’s long running profit decline, sizeable trailing losses, uncovered dividend, and debt that is not well supported by operating cash flow all point to balance sheet strain.
If those pressures make you cautious, you may want to focus on companies with stronger cushions and better funding for payouts. You can explore these by checking out solid balance sheet and fundamentals stocks screener (389 results) today.
This article by Simply Wall St is general in nature. We provide commentary based on historical data and analyst forecasts only using an unbiased methodology and our articles are not intended to be financial advice. It does not constitute a recommendation to buy or sell any stock, and does not take account of your objectives, or your financial situation. We aim to bring you long-term focused analysis driven by fundamental data. Note that our analysis may not factor in the latest price-sensitive company announcements or qualitative material. Simply Wall St has no position in any stocks mentioned.