XPO (XPO): Evaluating Valuation Following Strong Q3 Results and AI-Driven Margin Gains
XPO, Inc. XPO | 194.55 | +4.37% |
XPO (NYSE:XPO) has just released its third-quarter results, topping both earnings and revenue forecasts. The North American Less-Than-Truckload division led the way, with success attributed to AI-driven efficiency and stronger pricing, even as costs remain a challenge.
Shares of XPO have surged lately, with a 5.8% jump over the last day and a notable 14.4% gain in the past week, propelled by upbeat earnings and the completion of a buyback. While the stock logged a modest 8.6% share price return so far this year, its three-year total shareholder return stands out at over 327%. This reflects strong long-term momentum as management zeroes in on operational efficiency and network growth.
If this kind of growth story has you curious about where else momentum is building, it could be a good time to broaden your perspective and explore fast growing stocks with high insider ownership
Yet with shares soaring on upbeat results, investors are left wondering whether the latest rally leaves XPO undervalued, or if the market has already priced in all the future growth. This presents a tricky call for new buyers.
Most Popular Narrative: Fairly Valued
Despite recent gains, the most widely followed narrative sees XPO’s intrinsic worth closely aligned with its latest closing price. This suggests limited headroom for a sharp re-rating at the moment.
XPO's ongoing investments in AI-powered optimization and proprietary technology are driving measurable productivity gains, even in a weak freight market. These advancements are reducing linehaul miles, improving labor efficiency, and cutting maintenance costs. As industry shipping volumes recover and these technology benefits compound, this should drive sustained margin expansion and higher net income.
Curious what sets this valuation apart? The secret lies in aggressive earnings projections and margin shifts more typical of industry disruptors. The numbers challenge conventional wisdom. See which bullish assumptions push this fair value calculation sky-high.
Result: Fair Value of $141.52 (ABOUT RIGHT)
However, ongoing freight market weakness and rising labor costs could quickly undermine XPO’s momentum, which casts doubt on near-term growth assumptions.
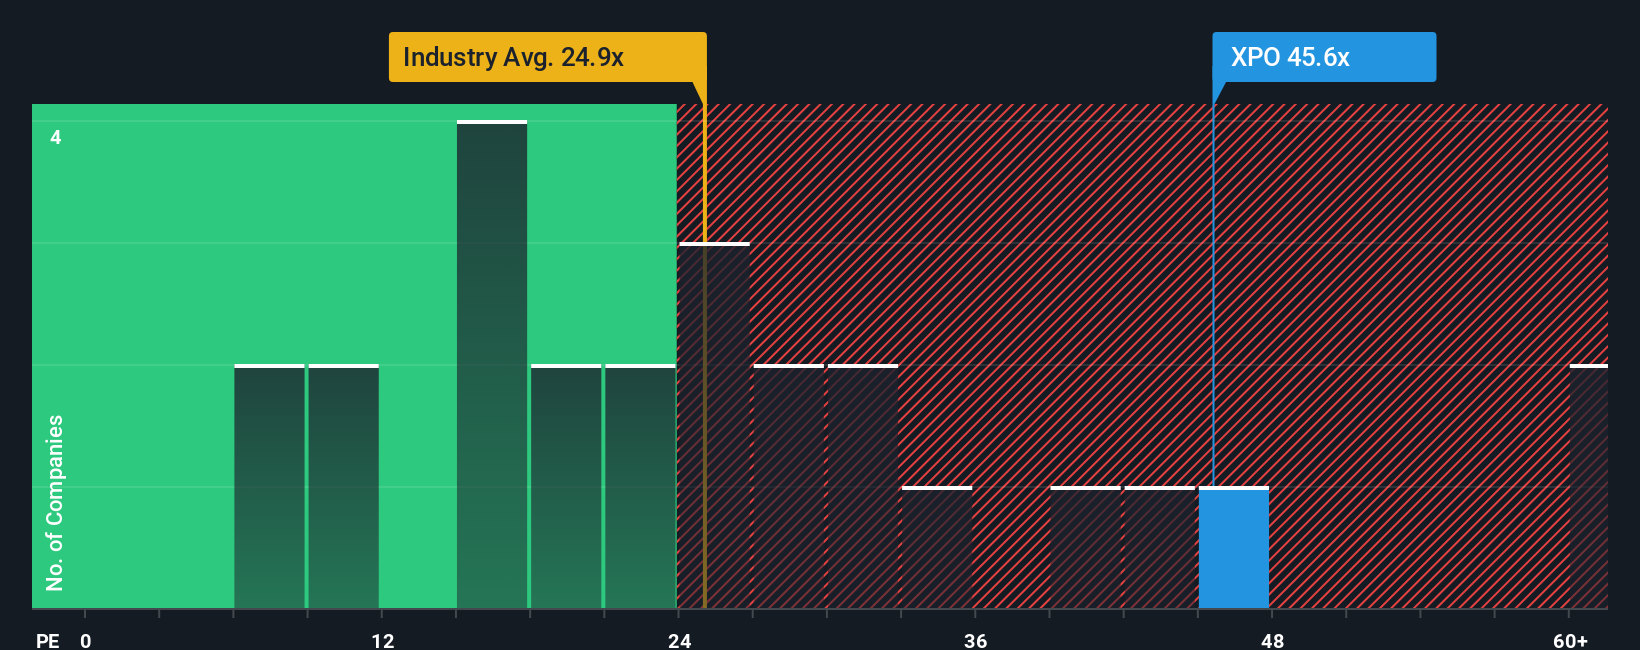
Another View: Multiple-Based Valuation
Looking at XPO through the lens of its price-to-earnings ratio reveals a different story. The stock trades at a lofty 50.9x, compared to its peers at 28x and an estimated fair ratio of just 18.5x. This significant gap suggests heightened valuation risks and limited margin for error if growth slows.
Simply Wall St performs a discounted cash flow (DCF) on every stock in the world every day (check out XPO for example). We show the entire calculation in full. You can track the result in your watchlist or portfolio and be alerted when this changes, or use our stock screener to discover 832 undervalued stocks based on their cash flows. If you save a screener we even alert you when new companies match - so you never miss a potential opportunity.
Build Your Own XPO Narrative
Want to dig deeper or double-check the story? You can analyze the numbers and craft your own narrative in just a few minutes: Do it your way
A great starting point for your XPO research is our analysis highlighting 2 key rewards and 1 important warning sign that could impact your investment decision.
Looking for More Investment Ideas?
Don’t let your search end here. The smartest investors act early, so check out these handpicked opportunities before everyone else notices their momentum.
- Capture exciting value opportunities and track down stocks underpriced by the market with these 832 undervalued stocks based on cash flows.
- Target reliable income streams while growing your portfolio through these 22 dividend stocks with yields > 3%, which features strong yields above 3%.
- Position yourself at the forefront of healthcare innovation by researching future leaders using these 33 healthcare AI stocks.
This article by Simply Wall St is general in nature. We provide commentary based on historical data and analyst forecasts only using an unbiased methodology and our articles are not intended to be financial advice. It does not constitute a recommendation to buy or sell any stock, and does not take account of your objectives, or your financial situation. We aim to bring you long-term focused analysis driven by fundamental data. Note that our analysis may not factor in the latest price-sensitive company announcements or qualitative material. Simply Wall St has no position in any stocks mentioned.