YETI Holdings (YETI) Valuation After Gross Margin Hit From Tariffs And Product Mix Shifts
YETI Holdings YETI | 36.36 | -1.97% |
YETI Holdings (YETI) shares were in focus after the latest quarter showed a sharp gross margin contraction, tied to tariff costs and a shift in product mix that raised fresh questions about profitability resilience.
That margin shock has come alongside a mixed price profile, with the latest share price at $47.43, a 1 day share price return of 2.93% decline and a 7 day share price return of 6.58% decline, but a 90 day share price return of 32.34% and 1 year total shareholder return of 22.15%. This suggests momentum has been building recently despite weaker longer term total shareholder return over 5 years.
If tariff pressure and shifting product economics have your attention, this can be a good moment to broaden your watchlist and check out fast growing stocks with high insider ownership.
With YETI shares well off their 5 year total return but showing a 90 day rebound and a sizeable implied intrinsic discount, you have to ask: is this a reset that offers upside, or is the market already baking in future growth?
Most Popular Narrative: 14.5% Overvalued
Against the last close at $47.43, the most followed narrative anchors on a fair value near $41.43, framing YETI as modestly overvalued on that view.
The company's accelerated international expansion, particularly robust growth and brand engagement in Europe and the rapid ramp up in Japan and Asia, is unlocking a large revenue opportunity in underpenetrated markets. This is expected to drive sustained double digit growth internationally and diversify global revenue streams.
Want to see what kind of revenue mix and margin profile would justify that fair value gap? The narrative leans on steady growth, firmer profitability and a lower future earnings multiple than many leisure peers. Curious how those ingredients add up to its valuation call.
Result: Fair Value of $41.43 (OVERVALUED)
However, you still need to weigh the risk that ongoing U.S. drinkware pressure and heavier competition will keep pricing, margins, and organic demand on a weaker footing.
Another Take: DCF Points the Other Way
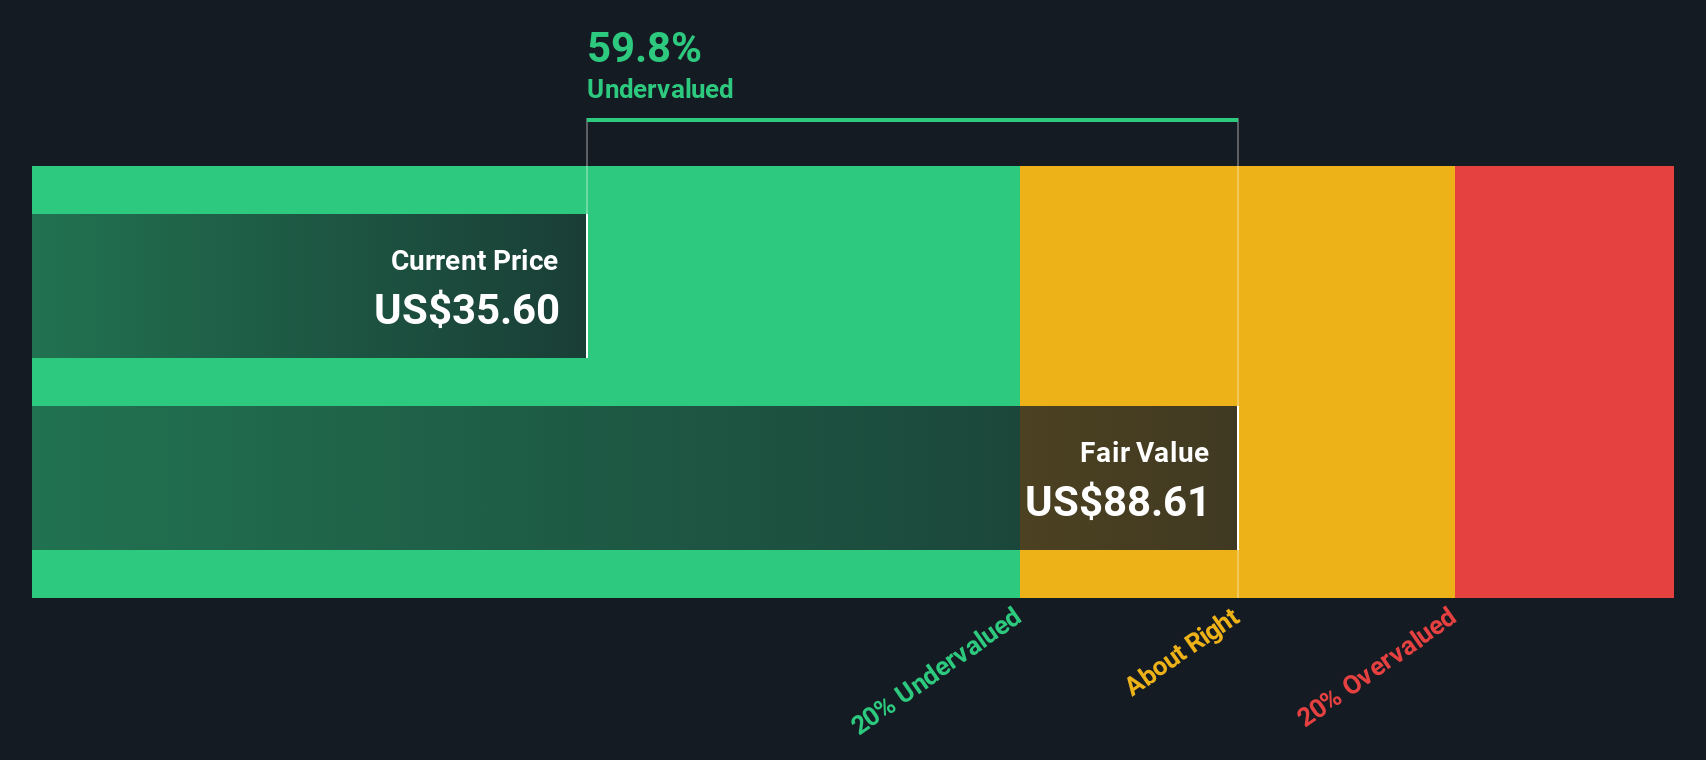
The narrative view calls YETI roughly 14.5% overvalued at a fair value of $41.43, but our DCF model presents a very different picture. It shows an estimated future cash flow value of $94.23 per share, almost double the current $47.43 price. Which perspective do you think aligns more closely with the business?
Simply Wall St performs a discounted cash flow (DCF) on every stock in the world every day (check out YETI Holdings for example). We show the entire calculation in full. You can track the result in your watchlist or portfolio and be alerted when this changes, or use our stock screener to discover 866 undervalued stocks based on their cash flows. If you save a screener we even alert you when new companies match - so you never miss a potential opportunity.
Build Your Own YETI Holdings Narrative
If you look at these numbers and reach a different conclusion, or simply want to test your own view against the data, you can build a custom thesis in just a few minutes by starting with Do it your way.
A good starting point is our analysis highlighting 2 key rewards investors are optimistic about regarding YETI Holdings.
Looking for more investment ideas?
If you only stop at YETI, you might miss other opportunities that fit your style, so take a few minutes to scan the wider market with focused screens.
- Target steadier cash flow potential by checking out these 14 dividend stocks with yields > 3% that may appeal if you value more consistent income.
- Spot underappreciated opportunities by running your eye over these 866 undervalued stocks based on cash flows that could align with a value focused approach.
- Ride long term tech shifts by reviewing these 18 cryptocurrency and blockchain stocks that link listed companies to digital assets and blockchain themes.
This article by Simply Wall St is general in nature. We provide commentary based on historical data and analyst forecasts only using an unbiased methodology and our articles are not intended to be financial advice. It does not constitute a recommendation to buy or sell any stock, and does not take account of your objectives, or your financial situation. We aim to bring you long-term focused analysis driven by fundamental data. Note that our analysis may not factor in the latest price-sensitive company announcements or qualitative material. Simply Wall St has no position in any stocks mentioned.