3 Stocks That Could Be Trading Up To 46.1% Below Their Estimated Intrinsic Value
Merck & Co., Inc. MRK | 0.00 |
Over the last 7 days, the United States market has risen 3.2%, contributing to a 31% increase over the past year, with earnings expected to grow by 16% per annum in the coming years. In this thriving environment, identifying stocks that are trading below their estimated intrinsic value can be an effective strategy for investors looking to capitalize on potential growth opportunities.
Top 10 Undervalued Stocks Based On Cash Flows In The United States
| Name | Current Price | Fair Value (Est) | Discount (Est) |
| Vertex (VERX) | $14.67 | $28.69 | 48.9% |
| Tutor Perini (TPC) | $81.96 | $156.84 | 47.7% |
| Travere Therapeutics (TVTX) | $42.66 | $83.80 | 49.1% |
| Solstice Advanced Materials (SOLS) | $77.76 | $154.05 | 49.5% |
| Reddit (RDDT) | $163.95 | $323.80 | 49.4% |
| Q2 Holdings (QTWO) | $50.69 | $98.55 | 48.6% |
| PACS Group (PACS) | $33.63 | $66.57 | 49.5% |
| Ouster (OUST) | $24.51 | $46.44 | 47.2% |
| Lazard (LAZ) | $46.44 | $88.83 | 47.7% |
| Janus Living (JAN) | $27.42 | $52.26 | 47.5% |
We'll examine a selection from our screener results.
Flex (FLEX)
Overview: Flex Ltd. offers technology innovation, supply chain, and manufacturing solutions across various industries including data center, communications, enterprise, consumer, automotive, industrial, healthcare, and power sectors with a market cap of approximately $49.54 billion.
Operations: Flex's revenue is driven by Flex Agility Solutions (FAS) with $14.78 billion and Flex Reliability Solutions (FRS) contributing $12.06 billion.
Estimated Discount To Fair Value: 13.1%
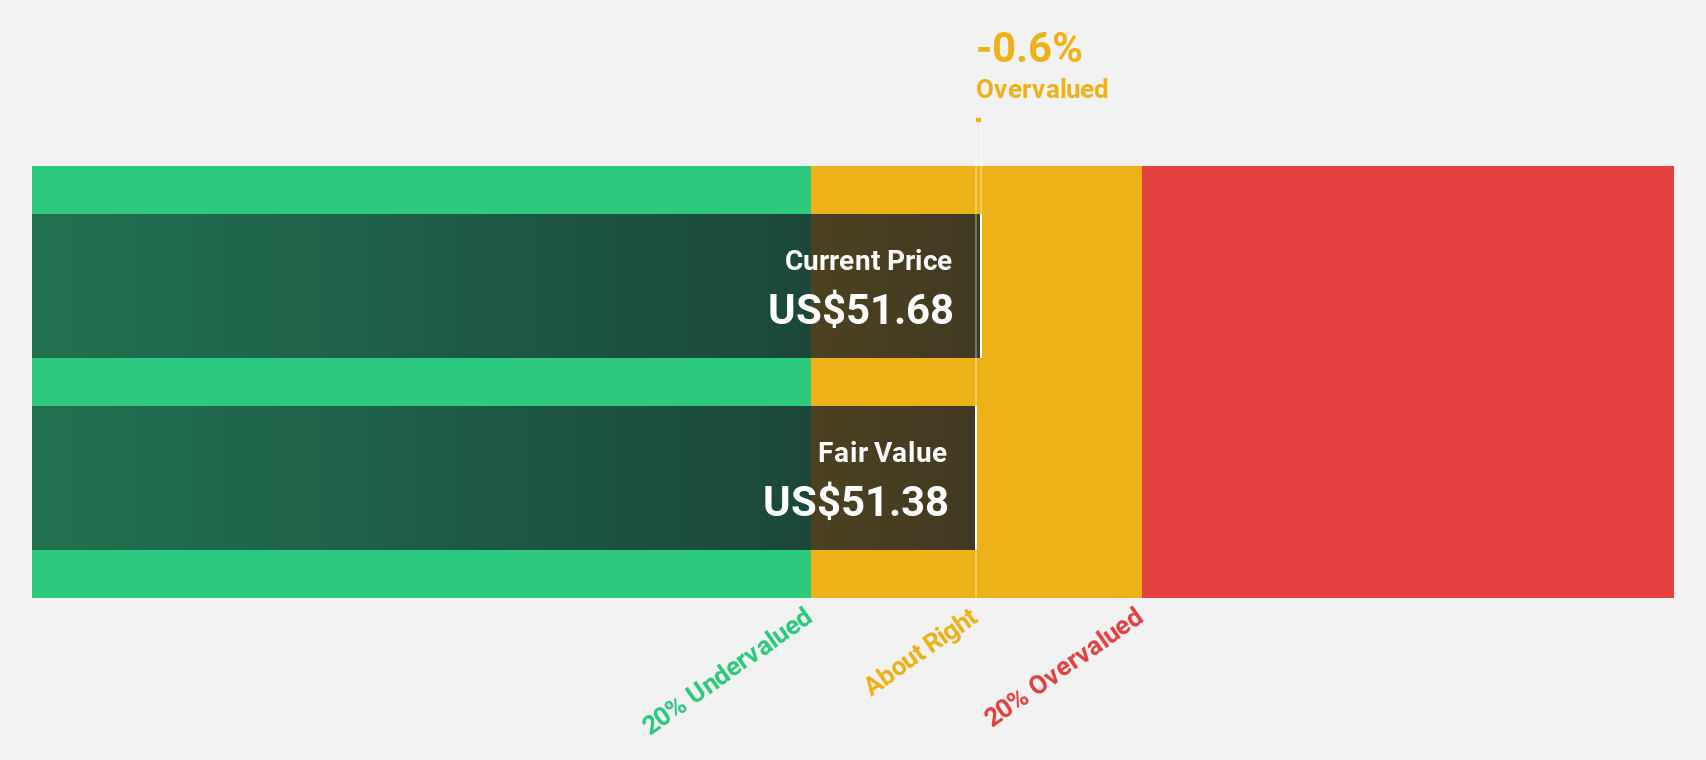
Flex Ltd. is trading at US$133.05, below its estimated future cash flow value of US$153.15, indicating it may be undervalued based on cash flows. The company's earnings are forecast to grow significantly at 42.2% annually over the next three years, outpacing the broader U.S. market's growth rate of 16.4%. Recent strategic moves include a spin-off and expanded partnerships in automation and AI infrastructure, potentially enhancing operational efficiencies and growth prospects despite recent share price volatility.
Zscaler (ZS)
Overview: Zscaler, Inc. is a global cloud security company with a market cap of approximately $22.32 billion.
Operations: Zscaler generates revenue primarily through sales of subscription services to its cloud platform and related support services, amounting to $3.00 billion.
Estimated Discount To Fair Value: 34.9%
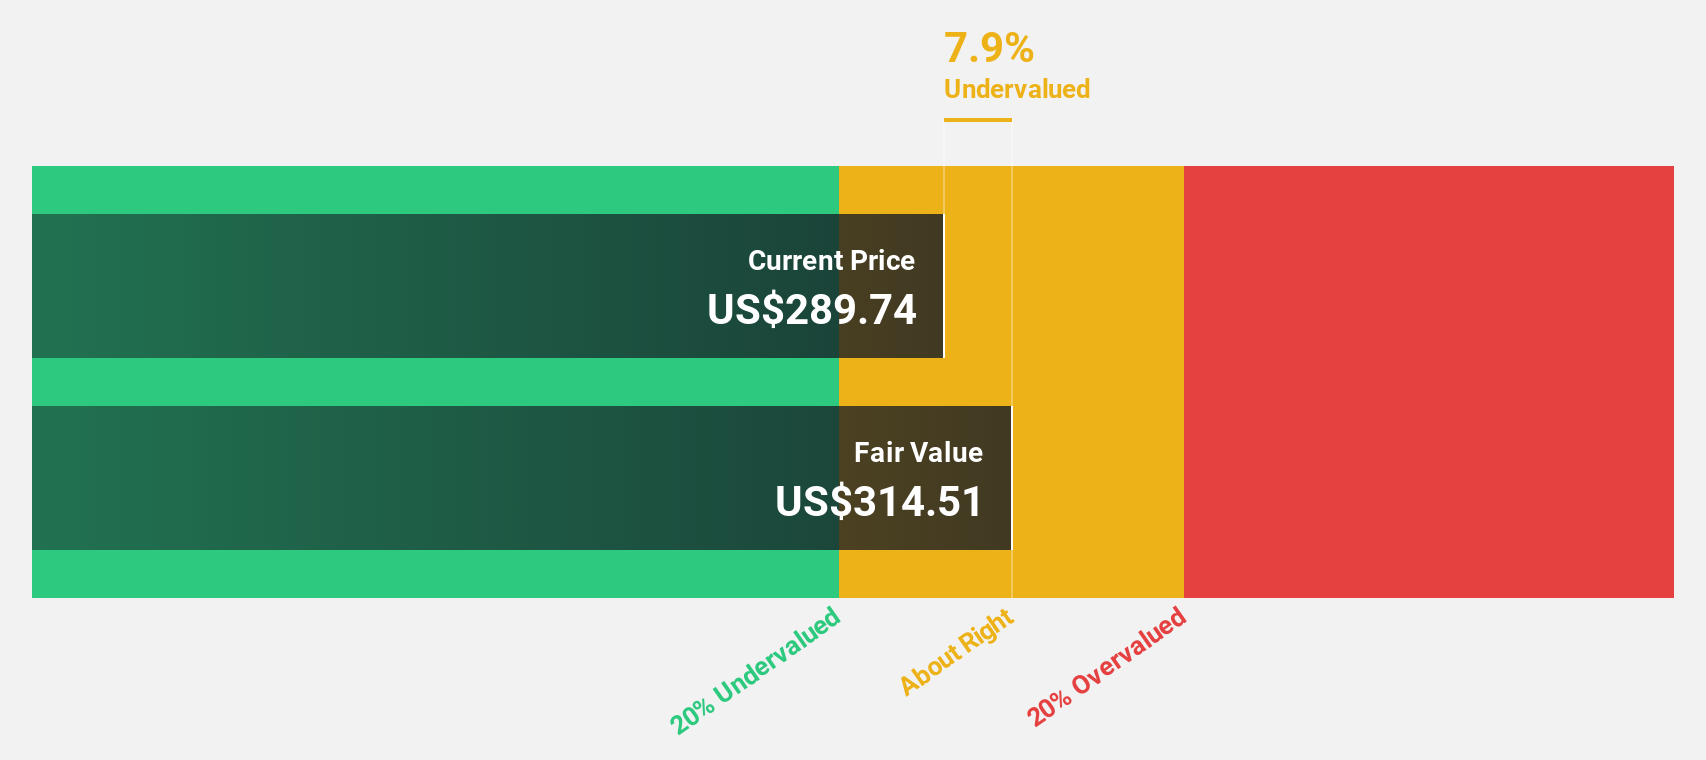
Zscaler, Inc. is trading at US$152.79, significantly below its estimated future cash flow value of US$234.8, suggesting potential undervaluation based on cash flows. The company anticipates strong revenue growth at 15.9% annually, surpassing the U.S. market average of 11.4%. Recent partnerships and technology integrations enhance its Zero Trust security offerings across IoT and cloud environments, potentially bolstering long-term profitability as it aims to achieve positive earnings in the next three years.
Merck (MRK)
Overview: Merck & Co., Inc. is a global healthcare company with operations worldwide and a market cap of approximately $280.47 billion.
Operations: The company's revenue is primarily derived from its Pharmaceutical segment, which accounts for $58.85 billion, and its Animal Health segment, contributing $6.56 billion.
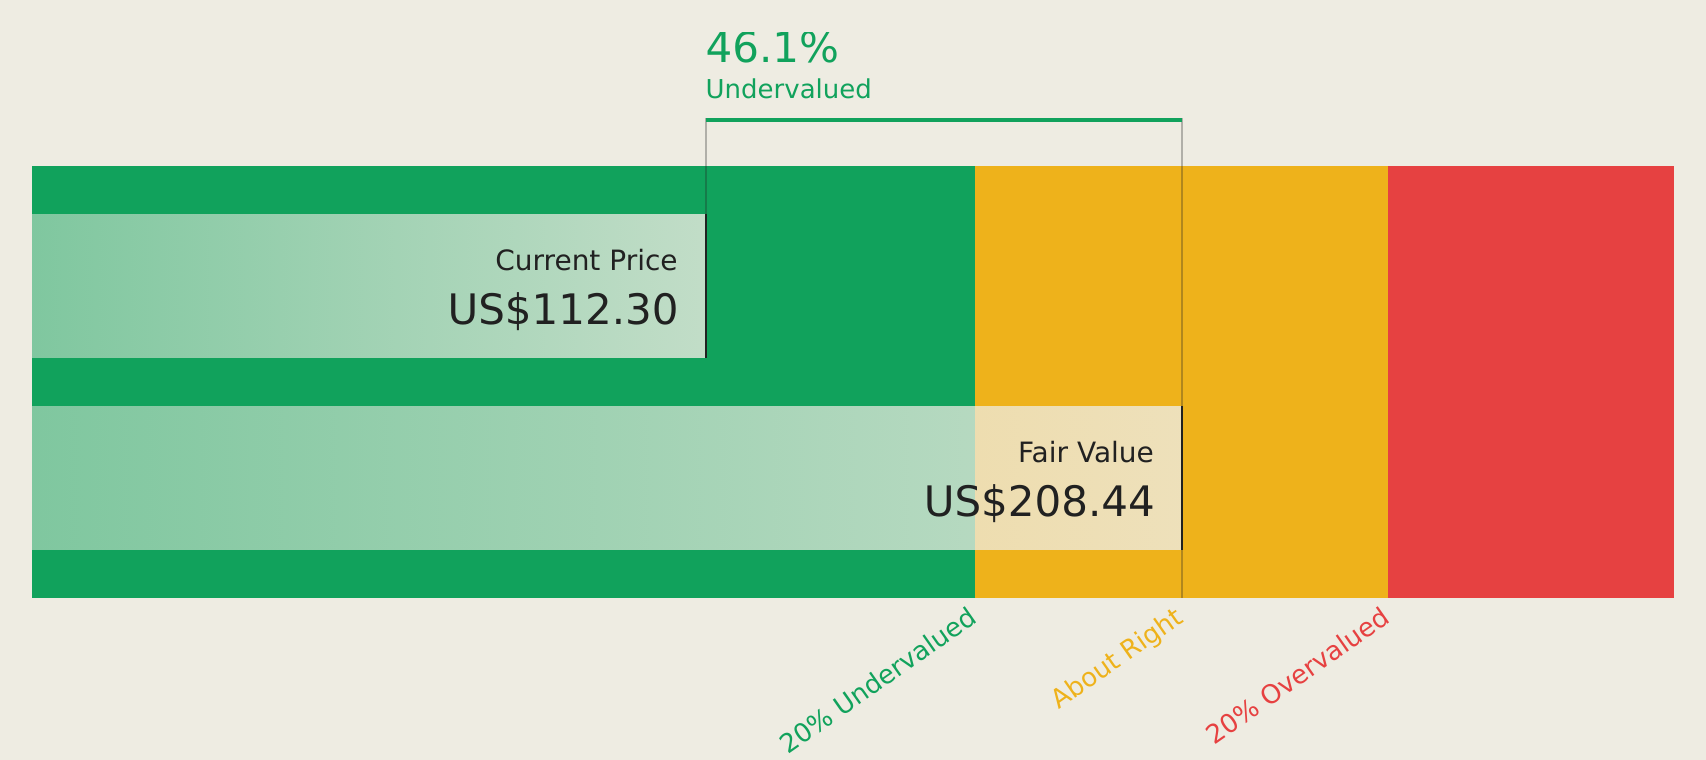
Estimated Discount To Fair Value: 46.1%
Merck's current trading price of US$112.3 is significantly below its estimated future cash flow value of US$208.44, indicating potential undervaluation based on cash flows. Despite a recent net loss due to large one-off items, Merck's earnings are forecasted to grow faster than the U.S. market at 21.2% annually over the next three years, driven by strategic product developments and FDA approvals like IDVYNSO for HIV treatment, although high debt levels remain a concern.
Summing It All Up
- Delve into our full catalog of 148 Undervalued US Stocks Based On Cash Flows here.
- Are any of these part of your asset mix? Tap into the analytical power of Simply Wall St's portfolio to get a 360-degree view on how they're shaping up.
- Enhance your investing ability with the Simply Wall St app and enjoy free access to essential market intelligence spanning every continent.
Ready To Venture Into Other Investment Styles?
- Explore high-performing small cap companies that haven't yet garnered significant analyst attention.
- Diversify your portfolio with solid dividend payers offering reliable income streams to weather potential market turbulence.
- Fuel your portfolio with companies showing strong growth potential, backed by optimistic outlooks both from analysts and management.
This article by Simply Wall St is general in nature. We provide commentary based on historical data and analyst forecasts only using an unbiased methodology and our articles are not intended to be financial advice. It does not constitute a recommendation to buy or sell any stock, and does not take account of your objectives, or your financial situation. We aim to bring you long-term focused analysis driven by fundamental data. Note that our analysis may not factor in the latest price-sensitive company announcements or qualitative material. Simply Wall St has no position in any stocks mentioned.