A Look At Amazon.com (AMZN) Valuation After Recent Share Price Pullback
Amazon.com AMZN | 0.00 |
Amazon.com stock snapshot after recent performance shift
Amazon.com (AMZN) has drawn fresh attention after a recent performance shift, with the stock down 1.2% on the day and 2.8% over the past week, yet higher over the past month and the past 3 months.
Despite the recent pullback, Amazon.com's momentum over the past year remains strong, with a 1 year total shareholder return of 25.76% and a 3 year total shareholder return of 134.41%, even after recent short term share price weakness.
If Amazon.com's moves have you thinking about where growth could appear next, it may be worth scanning for other giants powering digital infrastructure through 39 AI infrastructure stocks
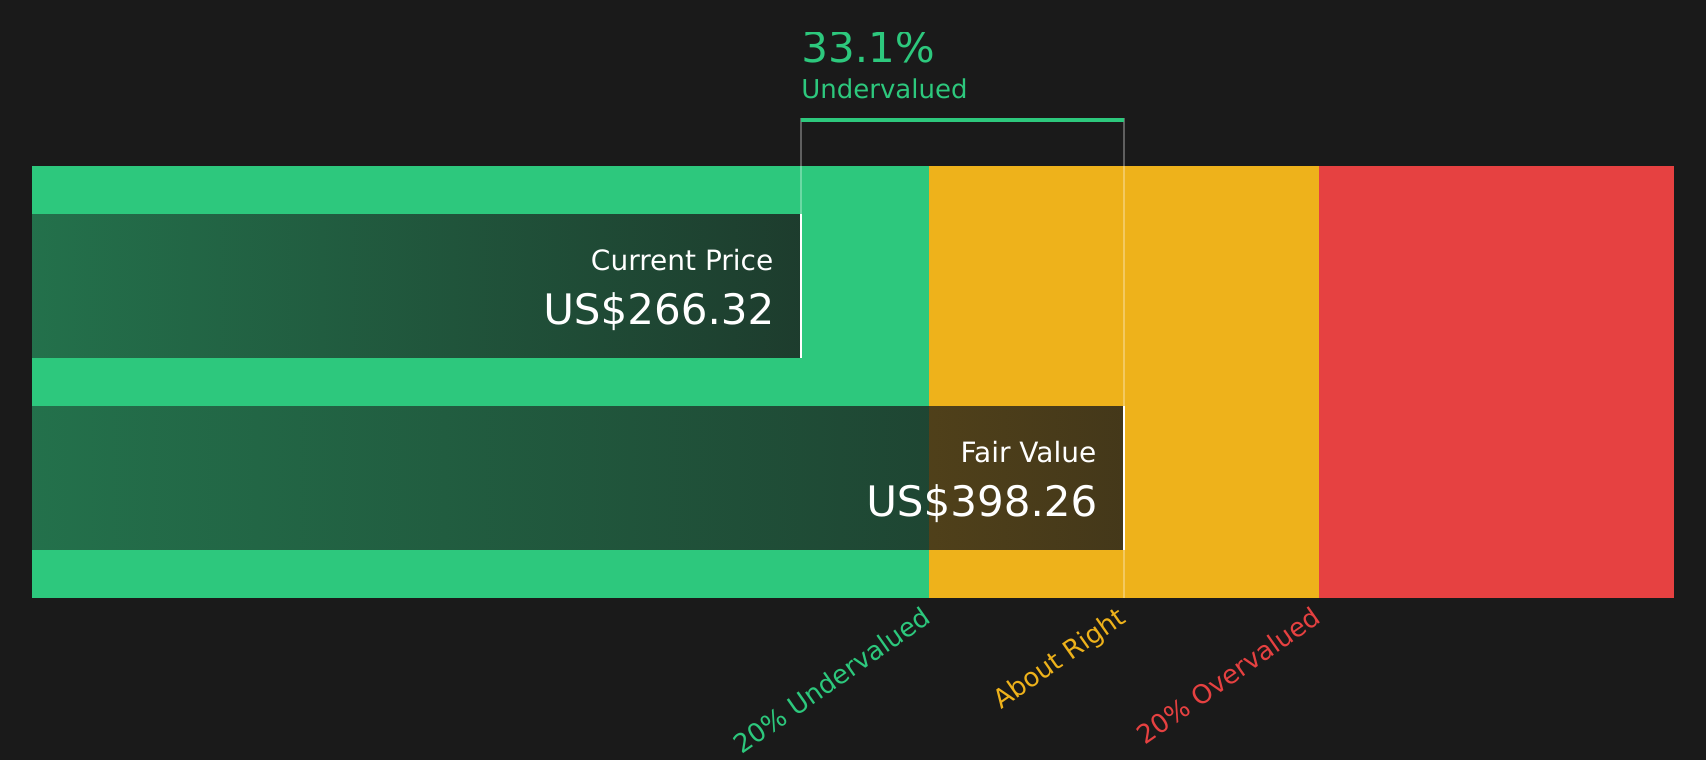
With Amazon.com posting double digit annual growth in revenue and net income and trading at a 33% discount to one intrinsic value estimate, the key question is simple: is there still a buying opportunity here, or is the market already pricing in future growth?
Price-to-earnings of 31.5x: Is it justified?
On a headline measure, Amazon.com trades on a P/E of 31.5x, which sits above both its global multiline retail peers and the broader peer group average.
The P/E ratio compares the share price to earnings per share, so a higher figure often reflects the market paying up for earnings strength or future growth potential. For a company with Amazon.com's scale and earnings profile, this ratio is a key shorthand for how much optimism is already in the price.
Here, the picture is mixed. On one hand, Amazon.com is described as good value when compared with an estimated fair P/E of 41.5x and is also trading 32.9% below one internal fair value estimate based on future cash flows of $395.99 versus the last close of $265.82. On the other hand, the current 31.5x multiple screens as expensive relative to the global multiline retail industry average of 18.9x and a peer average of 27.7x, which suggests the stock carries a premium that the market may be tying to its earnings growth record and high 20.5% return on equity that is considered high.
Against its industry, the contrast is clear. A 31.5x P/E sits well above the 18.9x global multiline retail benchmark and even above the 27.7x peer average, indicating investors are currently assigning Amazon.com a higher earnings multiple than many competitors, while the fair P/E reference of 41.5x points to a level the market could move towards if that optimism strengthens.
Result: Price-to-earnings of 31.5x (ABOUT RIGHT)
However, the story can change quickly if Amazon.com stumbles in key areas such as AWS or advertising, or if regulatory pressure starts to bite.
Another view: cash flow suggests a wider gap
While the 31.5x P/E hints at a premium stock, the SWS DCF model paints a different picture. On that approach, Amazon.com at $265.82 sits below an estimated future cash flow value of $395.99, implying the market price could be lagging the cash flow outlook.
Simply Wall St performs a discounted cash flow (DCF) on every stock in the world every day (check out Amazon.com for example). We show the entire calculation in full. You can track the result in your watchlist or portfolio and be alerted when this changes, or use our stock screener to discover 44 high quality undervalued stocks. If you save a screener we even alert you when new companies match - so you never miss a potential opportunity.
Next Steps
All of this paints a mixed picture, so it is worth looking at the numbers yourself and deciding how the balance of risk and reward feels to you. To see that balance clearly, review Amazon.com's 3 key rewards and 1 important warning sign
Looking for more investment ideas?
If Amazon.com has sharpened your focus, do not stop here. Widening your search now can help you spot opportunities before they become crowded trades.
- Target potential income anchors by reviewing companies in the 13 dividend fortresses that aim to pair sizeable yields with resilient business profiles.
- Zero in on quality at a discount by scanning the 44 high quality undervalued stocks for stocks where fundamentals and pricing appear out of sync.
- Reduce portfolio stress by checking the 69 resilient stocks with low risk scores for stocks that carry lower risk scores and steadier financial characteristics.
This article by Simply Wall St is general in nature. We provide commentary based on historical data and analyst forecasts only using an unbiased methodology and our articles are not intended to be financial advice. It does not constitute a recommendation to buy or sell any stock, and does not take account of your objectives, or your financial situation. We aim to bring you long-term focused analysis driven by fundamental data. Note that our analysis may not factor in the latest price-sensitive company announcements or qualitative material. Simply Wall St has no position in any stocks mentioned.