A Look At Apollo Global Management (APO) Valuation After Pomerantz Investigation And Epstein Related Disclosures
Apollo Global Management Inc APO | 114.82 115.70 | +4.43% +0.77% Pre |
Why Apollo Global Management (APO) Is In Focus Now
Pomerantz LLP has opened an investigation into Apollo Global Management (APO) after reports that senior executives discussed tax arrangements with Jeffrey Epstein in the 2010s despite earlier denials. This disclosure coincided with a sharp share price drop.
The Epstein related headlines and Pomerantz investigation have arrived after a weaker patch for the stock, with a 7 day share price return of 6% decline and a 30 day share price return of 13.18% decline. The 1 year total shareholder return of 22.10% decline contrasts with still strong 3 and 5 year total shareholder returns of 83.29% and 167.15% respectively, suggesting long term holders have seen substantial gains even as recent momentum has faded. Earnings for the fourth quarter of 2025, fresh leadership changes in EMEA, the Schroders partnership and ongoing buybacks all feed into how investors now weigh long standing performance against the latest legal and reputational risks at a share price of US$125.07.
If you want to see what else is moving in financials and beyond, this is a good moment to scan a screener containing 23 top founder-led companies.
With APO now showing a 22.10% decline in 1-year total shareholder return and trading at an estimated 43.98% discount to intrinsic value, investors may be asking whether this controversy-driven sell-off represents an opportunity or whether the market is already pricing in future growth.
Preferred Price-to-Earnings of 21.3x: Is It Justified?
On simple valuation metrics, Apollo Global Management trades on a P/E of 21.3x at a share price of $125.07, while our DCF work suggests the stock may be trading at a 44% discount to an estimated future cash flow value of $223.24.
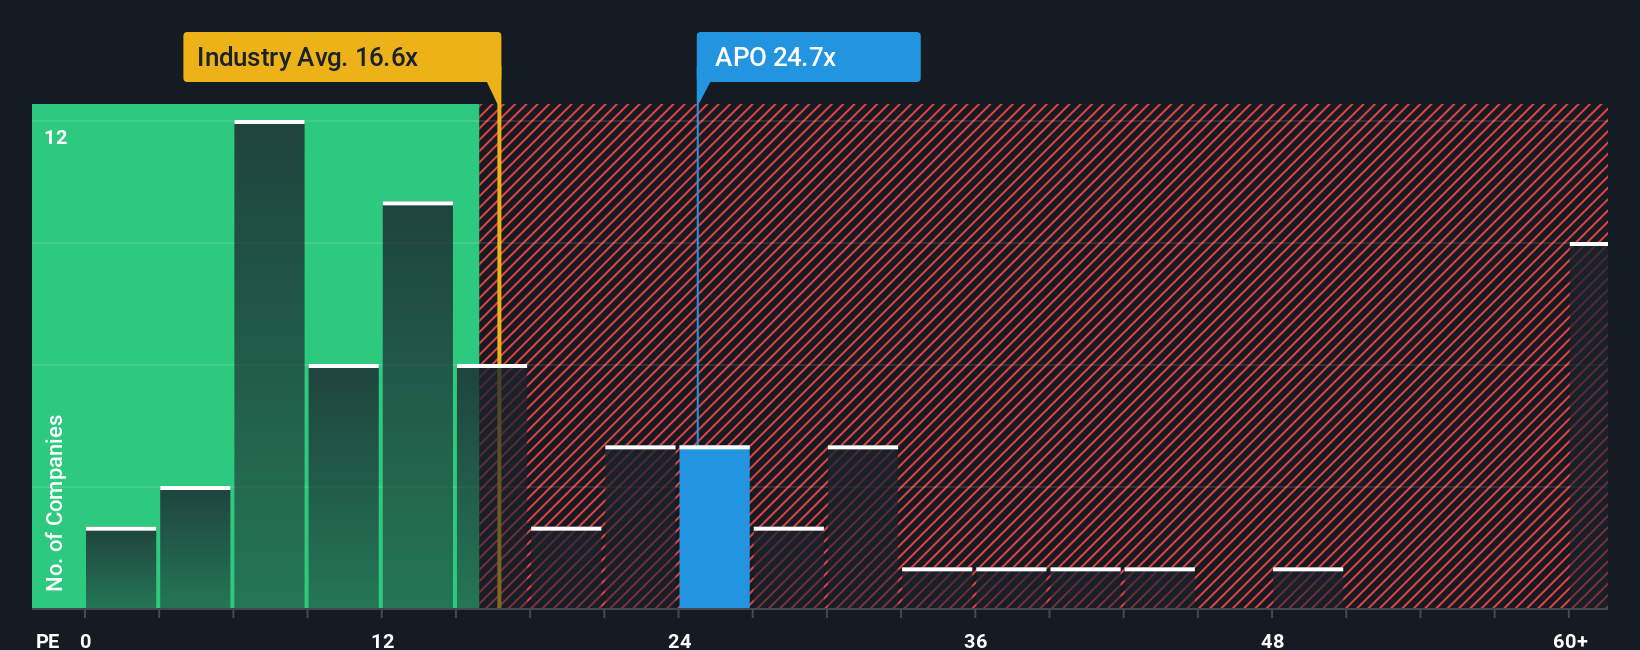
The P/E ratio compares the current share price to earnings per share. A higher multiple often reflects higher expectations for future earnings or a perception of higher quality, while a lower multiple can indicate more muted expectations or perceived risk. For Apollo Global Management, the 21.3x P/E sits above both the US Diversified Financial industry average of 15.3x and the peer average of 17.6x. This points to the market placing a richer tag on each dollar of current earnings.
At the same time, the SWS DCF model suggests Apollo Global Management is trading below an estimated future cash flow value of $223.24. This is consistent with statements that the shares appear to be at a 43.98% discount to intrinsic value and 44% below our estimate of fair value. That gap between a relatively high P/E and an apparently low DCF-based valuation highlights how much hinges on future earnings and cash flow delivery rather than just headline multiples.
Compared with the US Diversified Financial industry P/E of 15.3x and the peer average of 17.6x, Apollo Global Management’s 21.3x multiple is clearly richer. This suggests the market is assigning a premium to its earnings profile. However, against an estimated fair P/E of 23.8x, the current multiple sits below the level our fair ratio work implies the market could eventually move towards if those earnings expectations are met.
Result: Price-to-Earnings of 21.3x (ABOUT RIGHT)
However, you still have to weigh the legal and reputational overhang from the Epstein headlines, as well as the sharp 1 year total shareholder return decline of 22.10%.
Another View: P/E Premium Versus Peers
Our P/E work presents a different perspective compared with the earlier DCF discussion. At 21.3x earnings, Apollo Global Management trades at a richer valuation than the US Diversified Financial industry on 15.3x and peers on 17.6x. However, it is still below a 23.8x fair ratio that our work suggests the market could move toward.
This spread means you are paying more per dollar of current earnings than for many rivals, while the fair ratio points to some remaining potential upside if earnings develop in line with expectations. The question is how much P/E risk you are comfortable taking after a 1-year share price setback.
Simply Wall St performs a discounted cash flow (DCF) on every stock in the world every day (check out Apollo Global Management for example). We show the entire calculation in full. You can track the result in your watchlist or portfolio and be alerted when this changes, or use our stock screener to discover 53 high quality undervalued stocks. If you save a screener we even alert you when new companies match - so you never miss a potential opportunity.
Build Your Own Apollo Global Management Narrative
If you see the numbers differently or want to stress test your own assumptions, you can build a personalised Apollo Global Management view in just a few minutes using Do it your way.
A great starting point for your Apollo Global Management research is our analysis highlighting 3 key rewards and 3 important warning signs that could impact your investment decision.
Ready To Find Your Next Idea?
If Apollo Global Management is only one piece of your watchlist, this is the moment to cast the net wider and pressure test fresh opportunities.
- Target resilient cash generators by scanning companies on our 53 high quality undervalued stocks that pair quality fundamentals with prices that may not fully reflect their strengths.
- Prioritise durability and sleep better at night by focusing on businesses in our 85 resilient stocks with low risk scores that score well on stability and risk controls.
- Spot potential early movers before the crowd by reviewing a screener containing 23 high quality undiscovered gems that still fly under most investors' radar but show solid underlying metrics.
This article by Simply Wall St is general in nature. We provide commentary based on historical data and analyst forecasts only using an unbiased methodology and our articles are not intended to be financial advice. It does not constitute a recommendation to buy or sell any stock, and does not take account of your objectives, or your financial situation. We aim to bring you long-term focused analysis driven by fundamental data. Note that our analysis may not factor in the latest price-sensitive company announcements or qualitative material. Simply Wall St has no position in any stocks mentioned.