

A Look At ASML Holding’s (NasdaqGS:ASML) Valuation After Powerful Multi Year Shareholder Returns
ASML Holding NV ADR ASML | 0.00 |
Recent performance snapshot
ASML Holding (NasdaqGS:ASML) has drawn fresh attention after recent trading, with the stock last closing at $1,612.76. Investors are weighing this price against its long run of strong multi year total returns.
Short term sentiment has cooled slightly, with a 7 day share price return of 1.23% and a 90 day share price return of 11.18%. The 1 year total shareholder return of 120.35% highlights how strong longer term momentum has been overall.
If you are comparing ASML Holding with other chip related opportunities, it could be worth scanning a wider set of 47 AI infrastructure stocks
After such strong multi year returns and a recent share price above $1,600, the key question now is whether ASML is still trading at an attractive entry point or if the market is already pricing in future growth.
Price-to-earnings of 53.2x: Is it justified?
ASML is trading on a P/E of 53.2x at a last close of $1,612.76, which sits between its peer group and its estimated fair level.
The P/E ratio compares the current share price to earnings per share and is a quick way to see how much investors are paying for each dollar of profits. For a profitable chip equipment company like ASML, P/E is a useful guide because earnings are a key driver of long term value.
Relative to the US Semiconductor industry average of 66.9x and the peer average of 55.9x, ASML's 53.2x P/E suggests the market is assigning a premium, but not the highest premium available in the group. However, it is still above the estimated fair P/E of 43x, a level the market could move toward if sentiment cools or earnings do not keep pace with expectations.
Result: Price-to-earnings of 53.2x (OVERVALUED)
However, you still need to weigh risks, such as any slowdown in chip equipment demand or shifts in customer spending, that could challenge the current valuation.
Another view on ASML’s valuation
The P/E discussion presents ASML as expensive relative to its own fair ratio. Our DCF model, however, takes a different approach. On that view, the current price of $1,612.76 sits above an estimated future cash flow value of $777.54, indicating an overvalued stock on this second test. So which signal should be treated as more important?
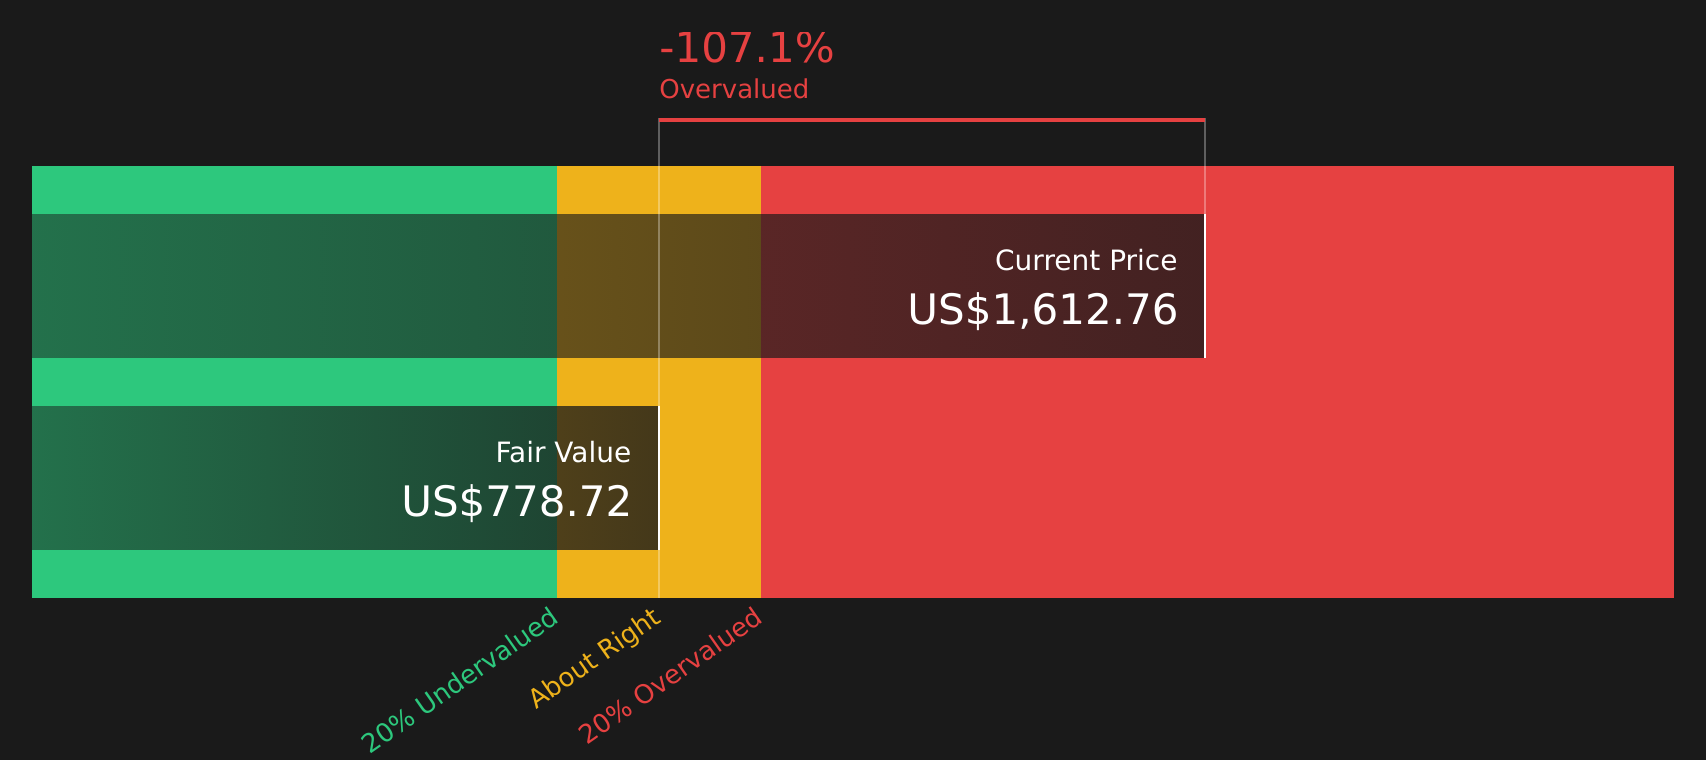
Simply Wall St performs a discounted cash flow (DCF) on every stock in the world every day (check out ASML Holding for example). We show the entire calculation in full. You can track the result in your watchlist or portfolio and be alerted when this changes, or use our stock screener to discover 46 high quality undervalued stocks. If you save a screener we even alert you when new companies match - so you never miss a potential opportunity.
Next Steps
The mix of strong past returns and a rich valuation can feel like a conflicting signal, so it is worth checking the numbers yourself and seeing what stands out most to you. To understand what the market already views positively, take a moment to review the company's 3 key rewards
Looking for more investment ideas?
If ASML feels fully priced, do not stop here. Use the Simply Wall St Screener to uncover fresh ideas that could better fit your goals.
- Jump on potential mispricings by scanning 46 high quality undervalued stocks that pair quality fundamentals with appealing valuations.
- Strengthen your income stream by reviewing 10 dividend fortresses that focus on higher yielding payers.
- Prioritise resilience by filtering for 62 resilient stocks with low risk scores that aim to balance opportunity with tighter risk controls.
This article by Simply Wall St is general in nature. We provide commentary based on historical data and analyst forecasts only using an unbiased methodology and our articles are not intended to be financial advice. It does not constitute a recommendation to buy or sell any stock, and does not take account of your objectives, or your financial situation. We aim to bring you long-term focused analysis driven by fundamental data. Note that our analysis may not factor in the latest price-sensitive company announcements or qualitative material. Simply Wall St has no position in any stocks mentioned.