A Look At IBM (IBM) Valuation As Shares Decline Despite Strong Multi Year Returns
IBM Corp IBM | 0.00 |
Stock performance and business profile
International Business Machines (IBM) has delivered mixed share performance recently, with the stock up about 91% over the past 3 years but down 25% year to date and 16% over the past year.
At a recent close of US$218.37 and a market value of about US$201.7b, IBM sits among the larger US technology and services companies. It combines software, consulting, infrastructure and financing under one umbrella.
The company reports annual revenue of US$68.9b and net income of US$10.7b, with revenue growth of 4.5% and net income growth of 5.9% based on the latest annual figures provided.
IBM’s software business is the largest contributor, followed by consulting and infrastructure. Financing is a smaller segment that supports client purchases of hardware, software and services.
Geographically, revenue is spread across the Americas, Europe/Middle East/Africa and Asia Pacific, which can matter for investors watching regional demand, currency effects and diversification of cash flows.
The share price has retreated sharply in recent months, with a 16.8% 90 day share price decline and weaker short term momentum set against a much stronger 3 year total shareholder return of 90.7%.
If IBM’s recent pullback has you rethinking your tech exposure, it could be a good moment to scan the broader AI ecosystem through 39 AI infrastructure stocks
With IBM’s shares down over the past year but still showing strong multi year returns, investors now face a key question: is the current valuation leaving upside on the table, or has the market already priced in future growth?
Most Popular Narrative: 10.6% Overvalued
According to the most followed narrative, IBM’s fair value sits at $197.36 compared with the recent share price of $218.37, putting the stock on the expensive side of that framework.
IBM represents a defensive growth technology investment transitioning into a software and AI-led enterprise platform company. While topline growth remains moderate, improving mix (software), strong margins, and durable cash flows underpin a compelling long-term investment case, particularly for investors seeking exposure to enterprise AI with lower volatility than pure-play SaaS peers.
Want to see what justifies paying more than this narrative’s fair value suggests? It leans heavily on profit margins, cash generation and a premium earnings multiple. Curious which assumptions really move the model?
Result: Fair Value of $197.36 (OVERVALUED)
However, this view can be tested quickly if AI adoption in IBM’s client base stalls, or if competition from larger cloud providers pressures pricing and margins.
Another view on fair value
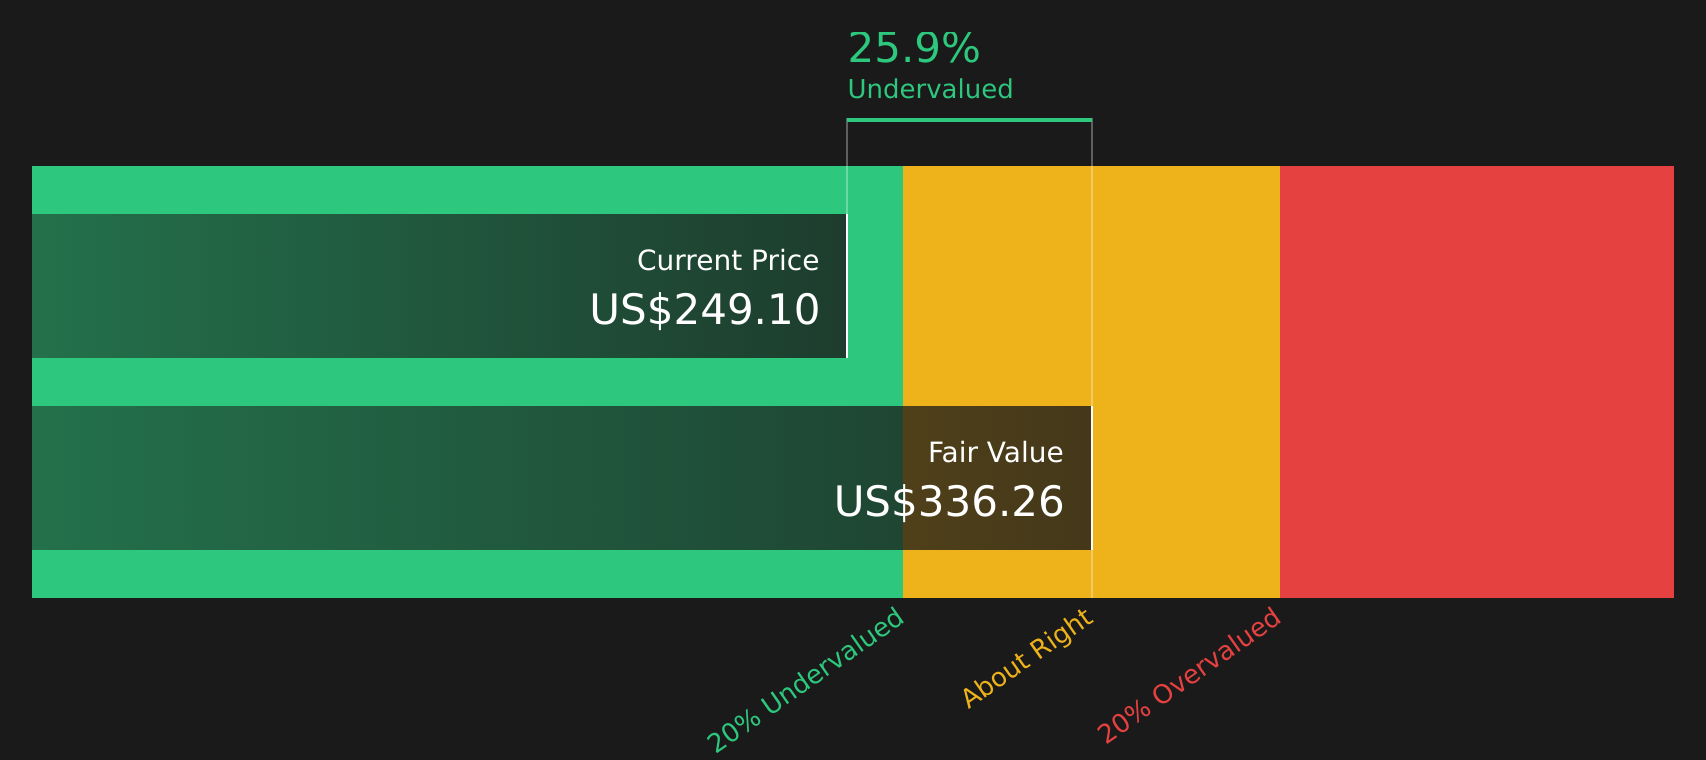
The user narrative sees IBM as about 10.6% overvalued at $218.37, but our DCF model points the other way. On that approach, IBM trades around 36.3% below an estimated future cash flow value of $342.96, which frames the recent share price weakness very differently. Which lens do you trust more when cash flows and sentiment diverge?
Simply Wall St performs a discounted cash flow (DCF) on every stock in the world every day (check out International Business Machines for example). We show the entire calculation in full. You can track the result in your watchlist or portfolio and be alerted when this changes, or use our stock screener to discover 47 high quality undervalued stocks. If you save a screener we even alert you when new companies match - so you never miss a potential opportunity.
Next Steps
After weighing IBM’s mixed share performance and split views on fair value, it may be helpful to quickly review the details yourself using the full breakdown of 5 key rewards and 1 important warning sign
Looking for more investment ideas?
IBM might be front of mind today, but your portfolio deserves a pipeline of other opportunities that match your goals, risk tolerance and income needs.
- Spot potential mispriced opportunities early by scanning 47 high quality undervalued stocks that combine quality fundamentals with what may be attractive entry points.
- Strengthen the core of your portfolio by focusing on companies in the solid balance sheet and fundamentals stocks screener (45 results) that can better handle tougher conditions.
- Seek out lesser known potential opportunities before they are crowded by using the screener containing 23 high quality undiscovered gems.
This article by Simply Wall St is general in nature. We provide commentary based on historical data and analyst forecasts only using an unbiased methodology and our articles are not intended to be financial advice. It does not constitute a recommendation to buy or sell any stock, and does not take account of your objectives, or your financial situation. We aim to bring you long-term focused analysis driven by fundamental data. Note that our analysis may not factor in the latest price-sensitive company announcements or qualitative material. Simply Wall St has no position in any stocks mentioned.