A Look At Nike (NKE) Valuation After RBC Downgrade And Slower Turnaround Concerns
NIKE NKE | 0.00 |
NIKE (NKE) is back in focus after RBC Capital Markets cut its rating to Sector Perform from Outperform, citing slower turnaround progress, operational friction between channels, and tougher competition in premium activewear.
The downgrade comes after a difficult period for shareholders, with the share price down about 19% over three months and the 1-year total shareholder return falling roughly 28%, even though the past month’s share price return has turned positive.
If weak sentiment around consumer brands has you reassessing your watchlist, this could be a good moment to widen your search and check out 20 top founder-led companies
With Nike stock down sharply over 1 and 3 years but trading at US$43.96, roughly 36% below the average analyst target and close to some intrinsic value estimates, you have to ask: is this a reset buying opportunity, or just fair pricing for slower growth?
Most Popular Narrative: 2.2% Overvalued
According to the most followed narrative, Nike’s fair value of $43.01 sits slightly below the last close at $43.96, which points to a small premium in the current price.
Nike (NKE) is a well-positioned company with a globally recognized brand and a dominant market presence, with $101.5 billion in market cap. As the industry leader, Nike benefits from significant economies of scale, allowing it to negotiate favorable terms with suppliers and maintain cost efficiency.
Want to understand why a strong global brand still lands near this fair value line? The narrative leans on measured revenue growth, firm margins, and a future earnings multiple that has been carefully calibrated against those cash flow assumptions.
Result: Fair Value of $43.01 (OVERVALUED)
However, slower progress on Nike’s turnaround and rising competition in premium activewear could pressure margins and weaken confidence in its current valuation story.
Wall Street's queuing for one rocket. While SpaceX counts down to its IPO, other companies tied to the new space race are already in orbit. → 20 Compelling Space Companies watchlist · Global Space Race Investing Ideas screener · Scan the sector by valuation on Rocket Lab's valuation page.
Another Angle: Fair on Cash Flows, Rich on Earnings
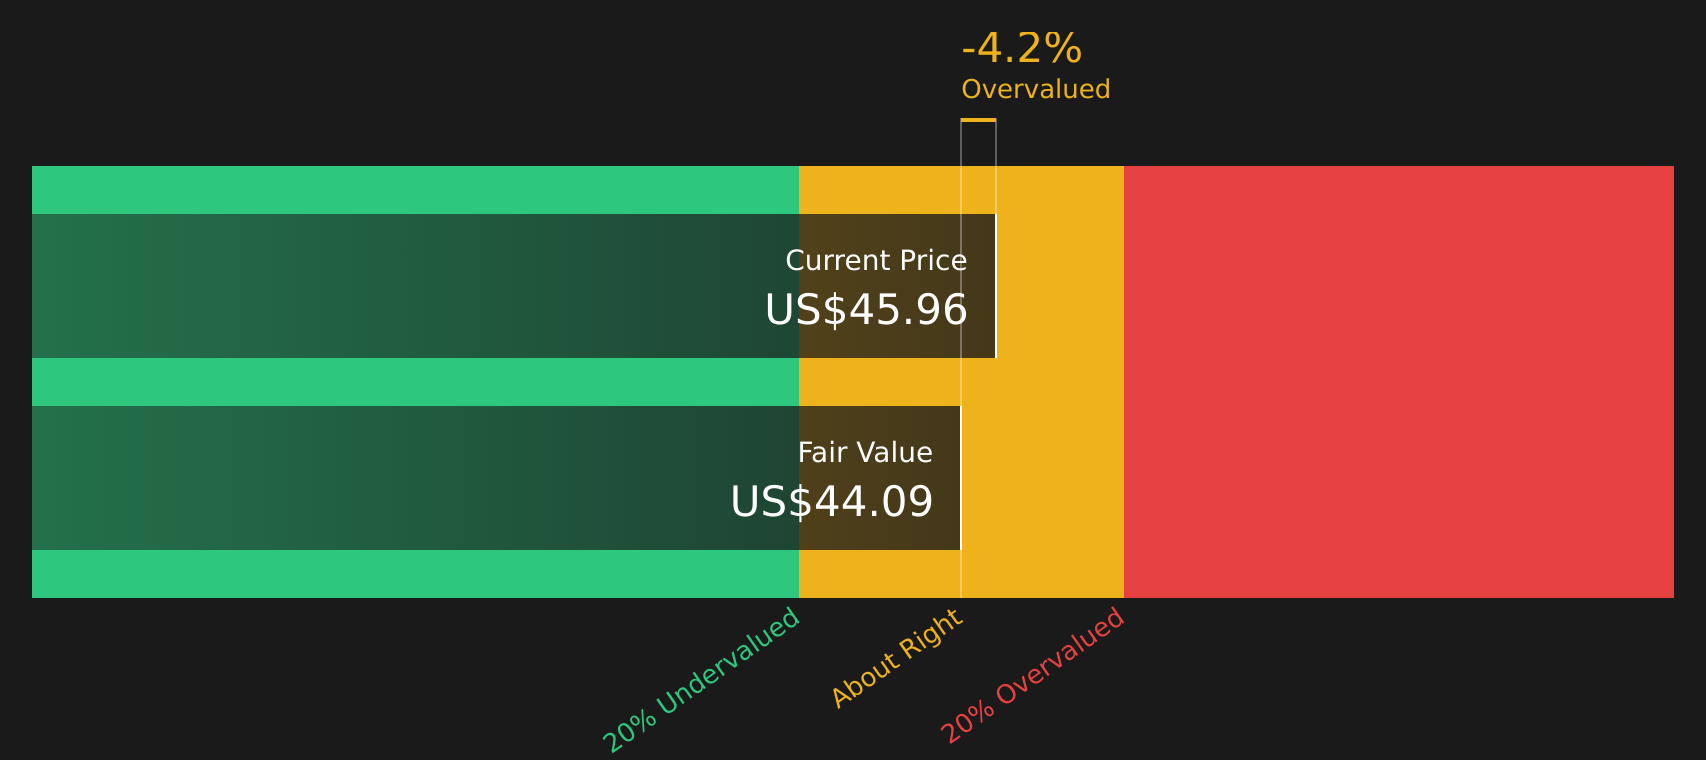
While the popular narrative pins Nike at roughly 2.2% overvalued on fair value, the SWS DCF model tells a slightly different story. At $43.96, the stock sits just below the model’s future cash flow value of $44.04, which points to a very small discount rather than a clear premium.
That lines up awkwardly with the current P/E of 28.9x, which looks expensive against the US Luxury industry at 23.7x, yet similar to peers at 29.3x and close to a fair ratio of 29.7x. Is the DCF hinting at limited downside, or is the earnings multiple still asking you to pay up for a slow reset?
Simply Wall St performs a discounted cash flow (DCF) on every stock in the world every day (check out NIKE for example). We show the entire calculation in full. You can track the result in your watchlist or portfolio and be alerted when this changes, or use our stock screener to discover 48 high quality undervalued stocks. If you save a screener we even alert you when new companies match - so you never miss a potential opportunity.
Next Steps
If this mix of concern and cautious optimism feels familiar, take some time now to look through the full picture and weigh it yourself with 2 key rewards and 2 important warning signs.
Ready for more investment ideas?
If Nike has you rethinking where your money works hardest, do not stop here. Broaden your watchlist with a few targeted idea lists built for different goals.
- Zero in on quality at a discount by scanning 48 high quality undervalued stocks that pair solid fundamentals with appealing pricing.
- Strengthen your income stream by reviewing 9 dividend fortresses that focus on higher yields with an emphasis on resilience.
- Stay on the cautious side of risk by checking 63 resilient stocks with low risk scores that prioritize sturdier financial profiles and lower volatility.
This article by Simply Wall St is general in nature. We provide commentary based on historical data and analyst forecasts only using an unbiased methodology and our articles are not intended to be financial advice. It does not constitute a recommendation to buy or sell any stock, and does not take account of your objectives, or your financial situation. We aim to bring you long-term focused analysis driven by fundamental data. Note that our analysis may not factor in the latest price-sensitive company announcements or qualitative material. Simply Wall St has no position in any stocks mentioned.