Amgen (AMGN) Stock After Horizon Deal And Strong Multi‑Year Gains Is Price Still Reasonable
Amgen Inc. AMGN | 0.00 |
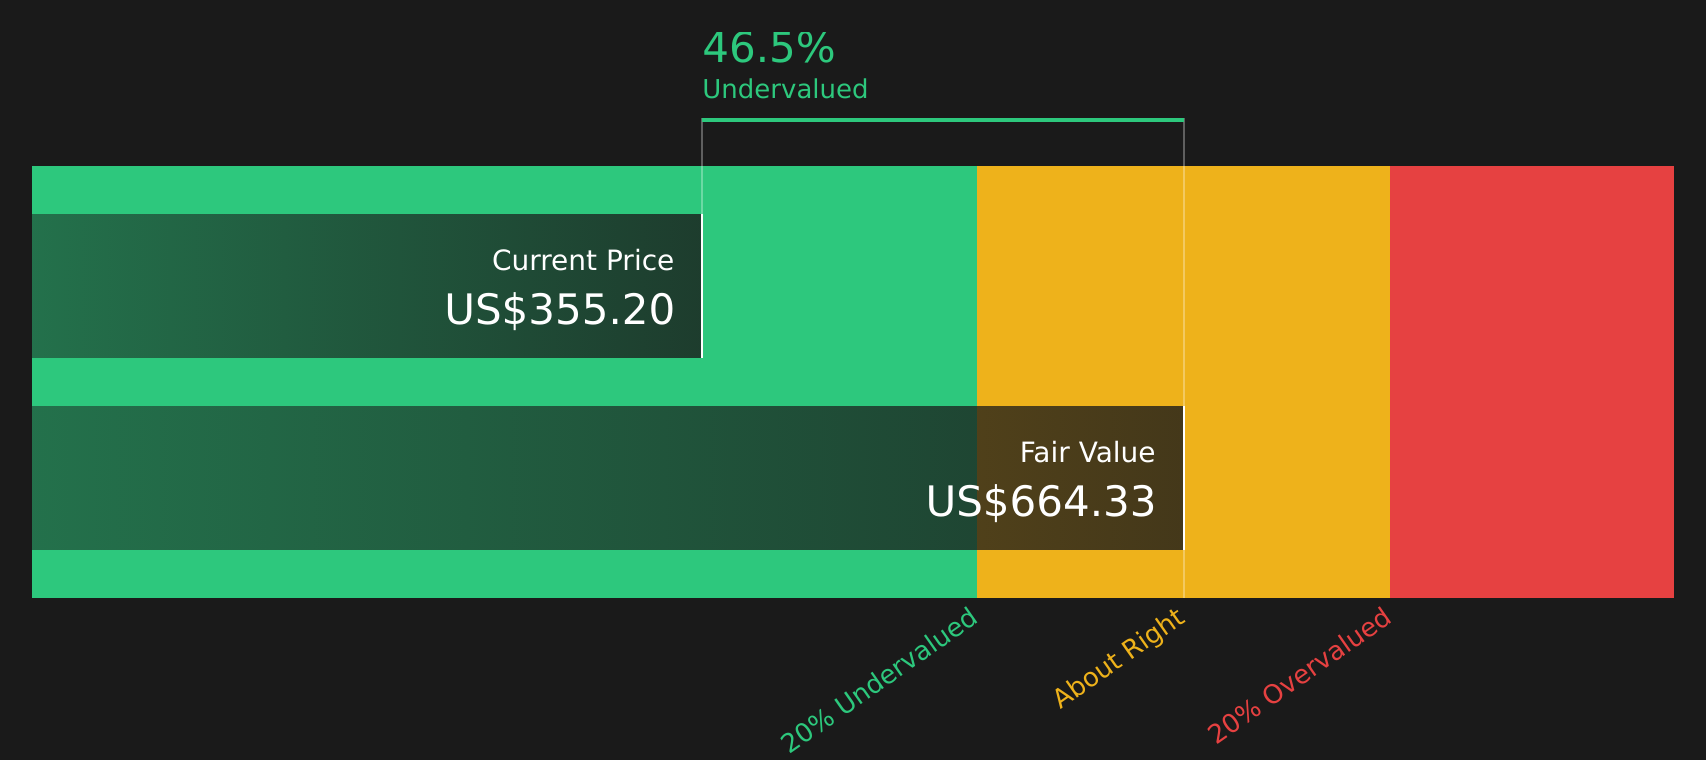
- If you are wondering whether Amgen at around US$355 per share is offering fair value or not, the starting point is to understand what the current price is actually baking in.
- Over shorter periods, the stock has returned 1.6% over the last week, 5.6% over the last month, 8.4% year to date and 23.9% over the past year, with longer term returns of 69.6% over three years and 74.2% over five years. This hints that the market narrative around the stock has shifted over time.
- Recent headlines have continued to focus on Amgen's position as a large US biotechnology company and its role in the broader pharmaceuticals and biotech sector. For investors, these updates provide context around why the stock has been in focus and help frame current expectations embedded in the share price.
- Right now, Amgen has a valuation score of 3 out of 6, which reflects how often it screens as undervalued across a set of standard checks. The next sections will unpack those methods while also pointing to a more complete way to think about valuation at the end of the article.
Approach 1: Amgen Discounted Cash Flow (DCF) Analysis
A Discounted Cash Flow, or DCF, model takes the cash Amgen is expected to generate in the future and discounts those amounts back to today using a required rate of return. The goal is to estimate what the entire stream of future cash flows is worth in today's dollars.
For Amgen, the latest twelve month Free Cash Flow (FCF) is about $9.1b. Analyst projections and subsequent extrapolations point to FCF of $13.4b in 2026 and $16.7b by 2030, with later years extended by Simply Wall St using modest percentage growth rates on top of those analyst inputs. All of these future cash flows are discounted back using a 2 Stage Free Cash Flow to Equity model.
On this basis, the DCF model arrives at an estimated intrinsic value of about $665.75 per share. Compared with the current share price around $355, this implies the stock screens as about 46.7% undervalued based on these cash flow assumptions and discount rate choices.
Result: UNDERVALUED
Our Discounted Cash Flow (DCF) analysis suggests Amgen is undervalued by 46.7%. Track this in your watchlist or portfolio, or discover 44 more high quality undervalued stocks.
Approach 2: Amgen Price vs Earnings (P/E)
For a profitable company like Amgen, the P/E ratio is a useful way to relate what you pay for the stock to the earnings it generates. It tells you how many dollars investors are currently willing to pay for each dollar of earnings.
What counts as a "normal" or "fair" P/E usually reflects what the market expects for future growth and how risky those earnings might be. Higher expected growth or lower perceived risk can justify a higher P/E, while lower expected growth or higher risk often lines up with a lower P/E.
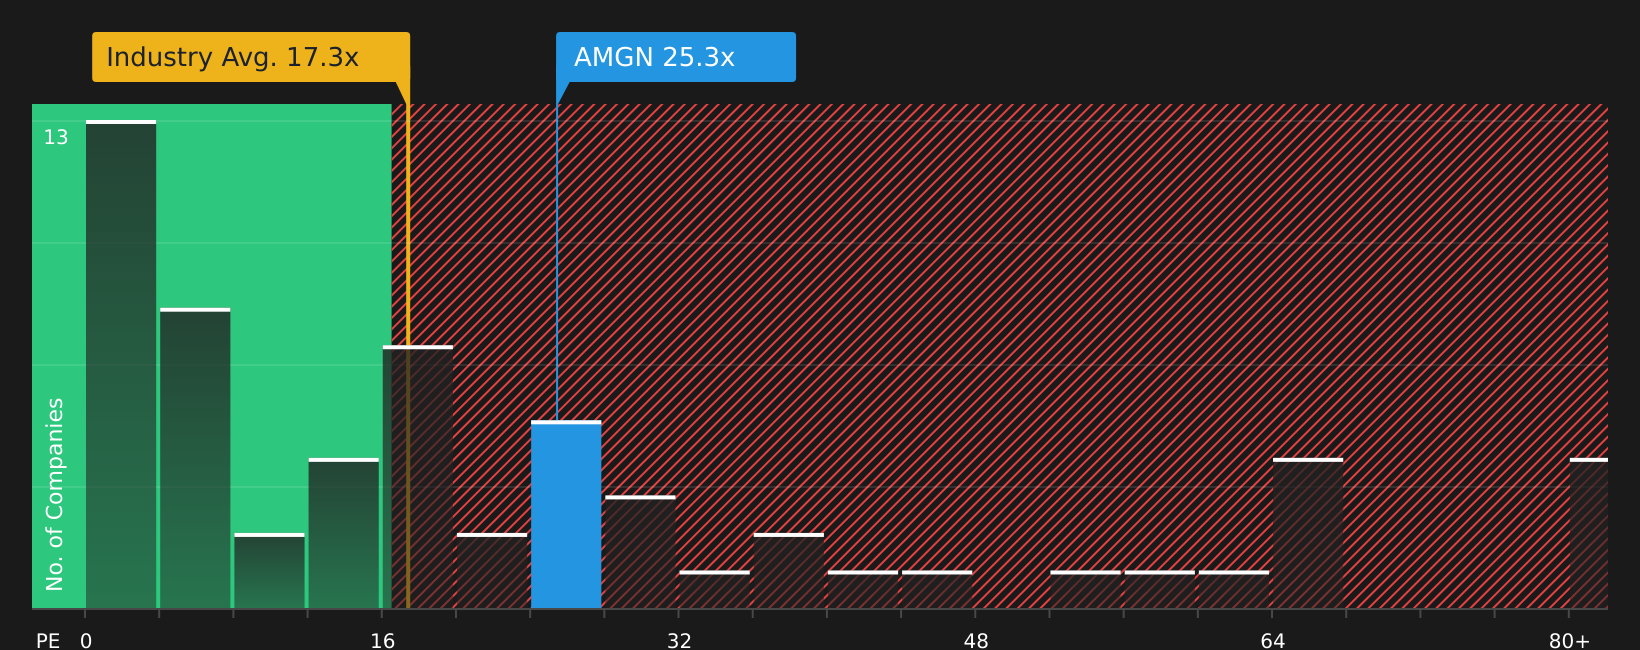
Amgen currently trades on a P/E of about 24.58x. That sits above the broader Biotechs industry average of 16.55x but below the peer group average of 42.24x. Simply Wall St also provides a proprietary Fair Ratio of 24.55x, which is an estimate of the P/E that might be reasonable given factors such as Amgen's earnings profile, margins, industry, market cap and company specific risks.
The Fair Ratio can be more useful than a simple peer or industry comparison because it adjusts for these company level factors rather than assuming all biotechs deserve the same multiple. With Amgen's current P/E of 24.58x very close to the Fair Ratio of 24.55x, the stock screens as ABOUT RIGHT on this measure.
Result: ABOUT RIGHT
P/E ratios tell one story, but what if the real opportunity lies elsewhere? Start investing in legacies, not executives. Discover our 20 top founder-led companies.
Upgrade Your Decision Making: Choose your Amgen Narrative
Earlier it was mentioned that there is an even better way to understand valuation. Narratives take the story you believe about Amgen, such as whether it is closer to the bullish US$432 fair value view or the bearish US$243.49 view, connect that story to explicit assumptions for future revenue, earnings and margins, translate those into a Fair Value, compare that Fair Value with the current price so you can decide whether the stock looks expensive or cheap, and then keep updating that picture automatically when new news or earnings arrive, all through an easy to use tool on Simply Wall St's Community page that millions of investors already use.
For Amgen however we will make it really easy for you with previews of two leading Amgen Narratives:
Start by picking the version of the story that feels closer to how you see the business, then test whether the assumptions behind it actually line up with your expectations for the next few years.
Fair value used in this bullish narrative: US$432.00 per share.
At the last close of US$355.18, the price sits about 17.8% below that fair value, using ((432.00 minus 355.18) divided by 432.00).
Revenue growth assumption in this narrative: 6.52% a year.
- Leans on a broad autoimmune and cardiovascular pipeline, where analysts expect a mix of obesity, oncology, inflammation and rare disease drugs to support higher future earnings and margins.
- Assumes Amgen can handle pricing pressure and competition through its biologics and biosimilars presence, global reach, and capacity for further acquisitions after the Horizon deal.
- Accepts meaningful risks around drug pricing reforms, patent expiries, R&D spending, deal execution and biosimilar competition, but treats these as manageable relative to the upside in the late stage pipeline.
Fair value used in this more cautious narrative: about US$352.23 per share.
At the last close of US$355.18, the price sits about 0.8% above that fair value, using ((355.18 minus 352.23) divided by 352.23).
Revenue growth assumption in this narrative: 2.53% a year.
- Builds on demand for therapies in chronic and age related diseases and on rare disease opportunities, but treats these as broadly in line with what is already reflected in current prices.
- Assumes moderate improvements in profit margins, supported by biosimilars and digital efficiency gains, but also higher manufacturing and R&D investment needs.
- Emphasises headwinds from drug price pressure, biosimilar rivals, regulatory uncertainty and slower demographic growth, which together could limit upside if newer products do not fully offset those challenges.
If neither view quite matches your own expectations for Amgen's growth, margins and risks, you can adjust the assumptions inside a custom narrative so the fair value reflects your personal thesis rather than someone else's starting point. Curious how numbers become stories that shape markets? Explore Community Narratives
Do you think there's more to the story for Amgen? Head over to our Community to see what others are saying!

This article by Simply Wall St is general in nature. We provide commentary based on historical data and analyst forecasts only using an unbiased methodology and our articles are not intended to be financial advice. It does not constitute a recommendation to buy or sell any stock, and does not take account of your objectives, or your financial situation. We aim to bring you long-term focused analysis driven by fundamental data. Note that our analysis may not factor in the latest price-sensitive company announcements or qualitative material. Simply Wall St has no position in any stocks mentioned.