Assessing Applied Materials (AMAT) After A 108% One Year Share Price Surge
Applied Materials, Inc. AMAT | 395.64 394.30 | -0.02% -0.34% Pre |
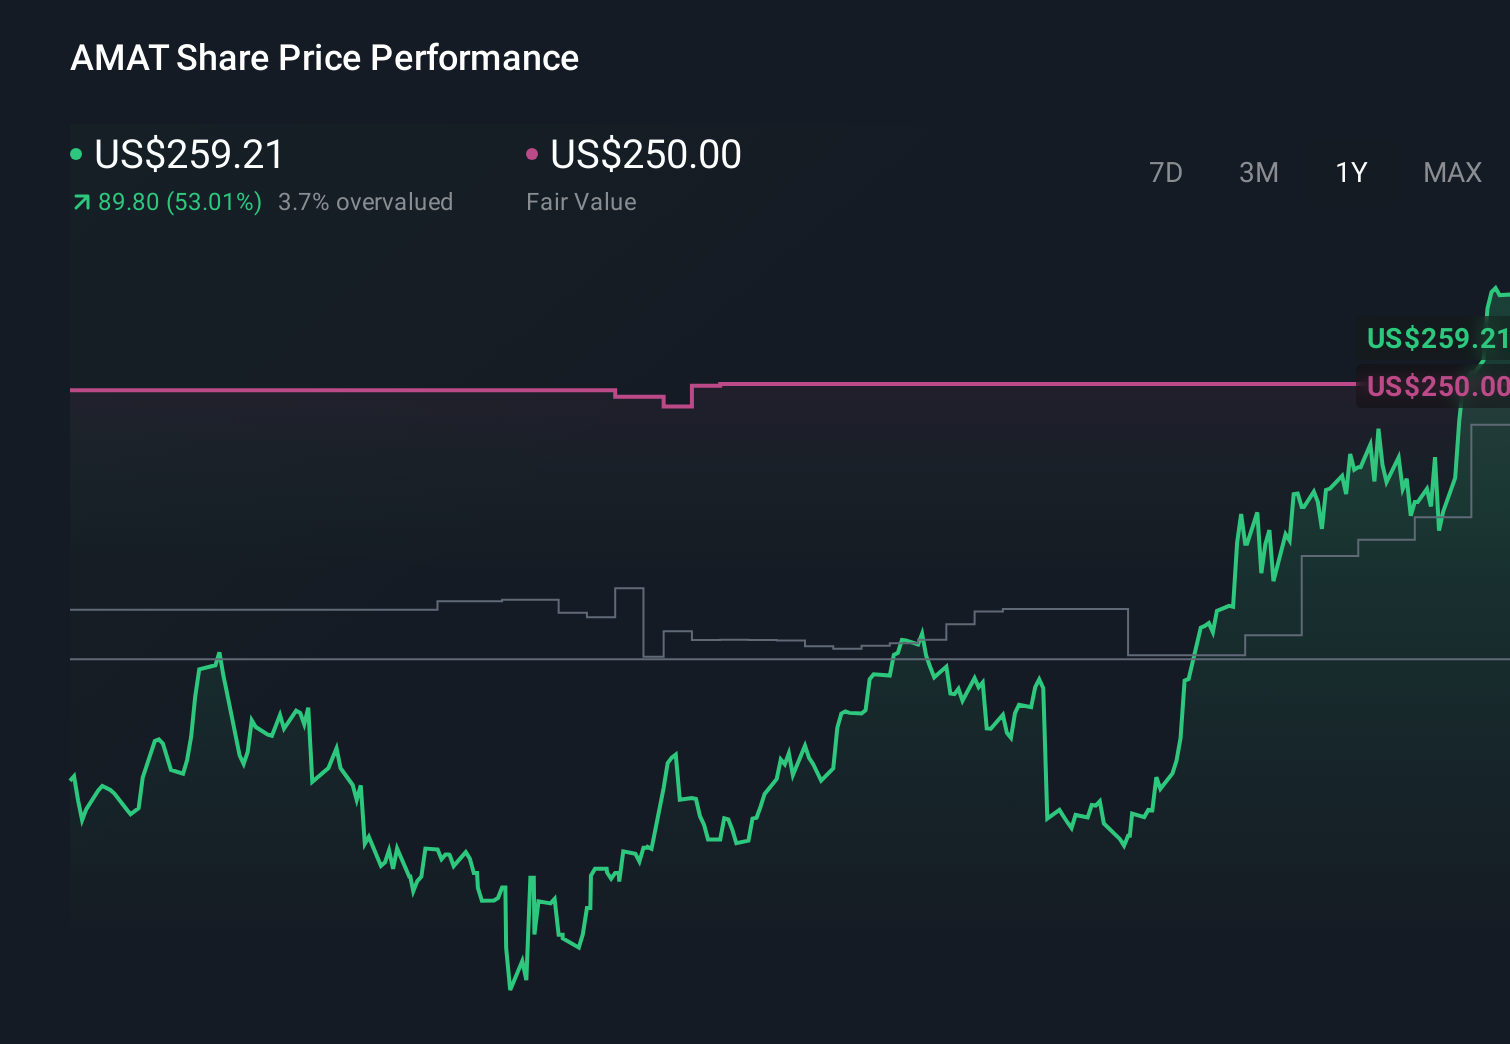
- If you are wondering whether Applied Materials' share price still reflects good value after its strong run, it helps to step back and look at what the current market price might be implying about the business.
- The stock last closed at US$354.91, with returns of 7.9% over 7 days, 8.5% over 30 days, 32.0% year to date, and 108.4% over the past year, which naturally raises questions about how much of the story is already priced in and how risk is being perceived.
- Recent attention around Applied Materials has largely centered on its role as a key supplier to the semiconductor industry and how investor interest in chip related themes is feeding through to equipment makers. That backdrop is important context when thinking about whether the current share price is mainly reflecting enthusiasm for the sector or the company’s own fundamentals.
- Right now, our valuation framework gives Applied Materials a value score of 3 out of 6, based on how many checks suggest the stock could be undervalued. Next, we will walk through the main valuation approaches before finishing with a way to look beyond simple ratios and models.
Approach 1: Applied Materials Discounted Cash Flow (DCF) Analysis
A Discounted Cash Flow, or DCF, model takes forecasts of a company’s future cash flows and discounts them back to today using a required rate of return, to estimate what the business might be worth right now.
For Applied Materials, the model here is a 2 Stage Free Cash Flow to Equity approach, using Free Cash Flow (FCF) in $. The latest twelve month FCF is about $7.0b. Analysts provide detailed estimates for the next few years. Beyond that, Simply Wall St extrapolates to build a full 10 year path. By 2030, projected FCF is $11.4b, with intermediate years ranging from roughly $6.2b in 2026 to $14.4b in 2035 in the extended extrapolation.
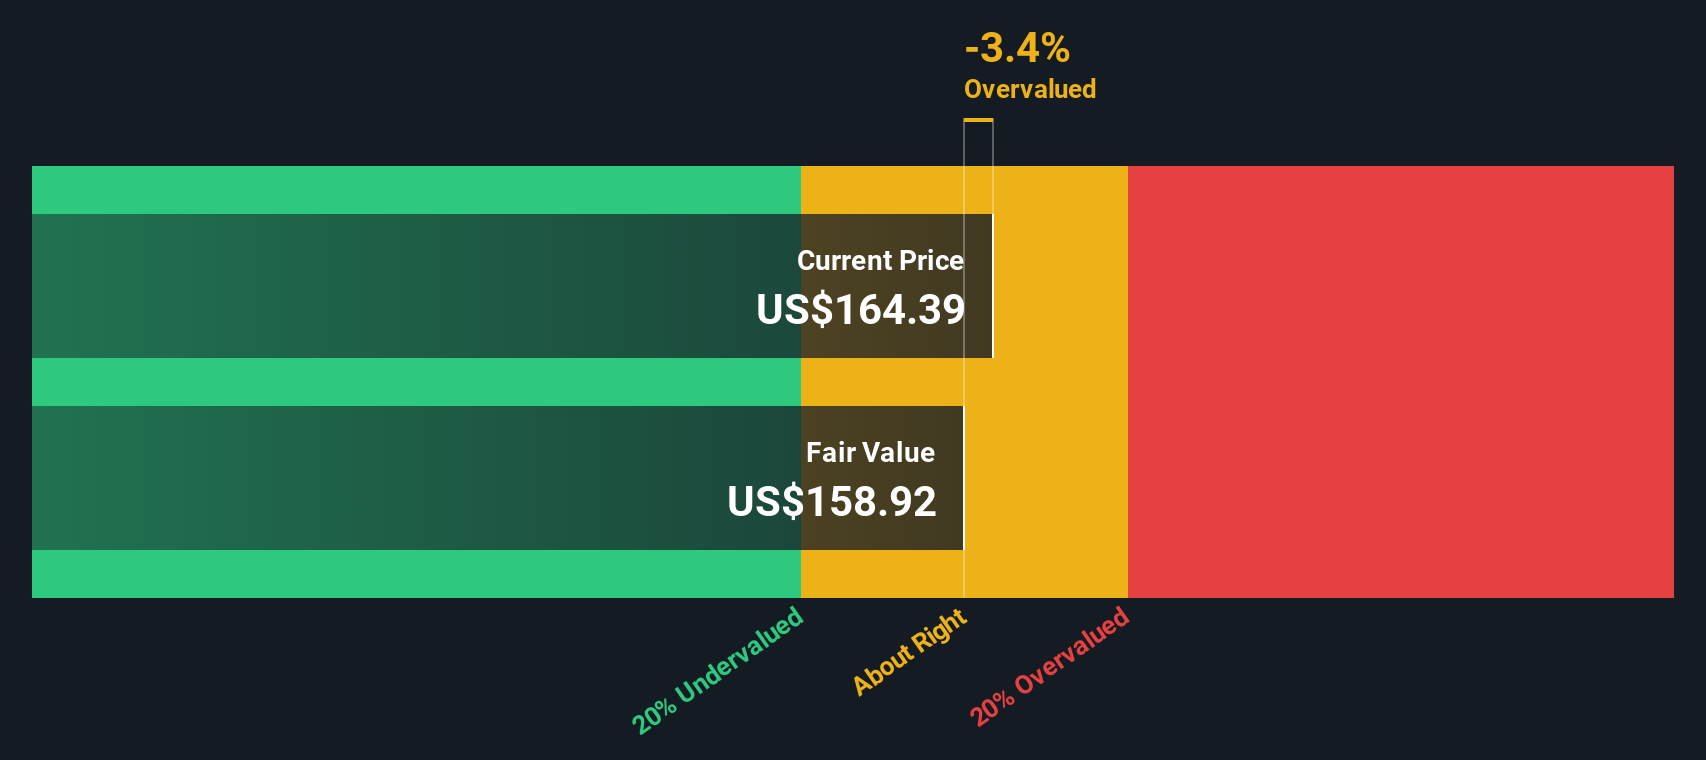
Discounting those projected cash flows back to today gives an estimated intrinsic value of about $177.83 per share. Against the recent market price of $354.91, the model suggests the stock is about 99.6% above this cash flow based estimate, so on this framework it screens as expensive rather than cheap.
Result: OVERVALUED
Our Discounted Cash Flow (DCF) analysis suggests Applied Materials may be overvalued by 99.6%. Discover 55 high quality undervalued stocks or create your own screener to find better value opportunities.
Approach 2: Applied Materials Price vs Earnings
For a profitable company like Applied Materials, the P/E ratio is a useful way to relate what you pay for each share to the earnings that support it. It helps you see how many dollars of price the market is assigning to each dollar of current earnings.
What counts as a normal or fair P/E depends heavily on how the market views growth potential and risk. Higher expected earnings growth or lower perceived risk can justify a higher P/E, while slower growth or higher risk usually points to a lower multiple.
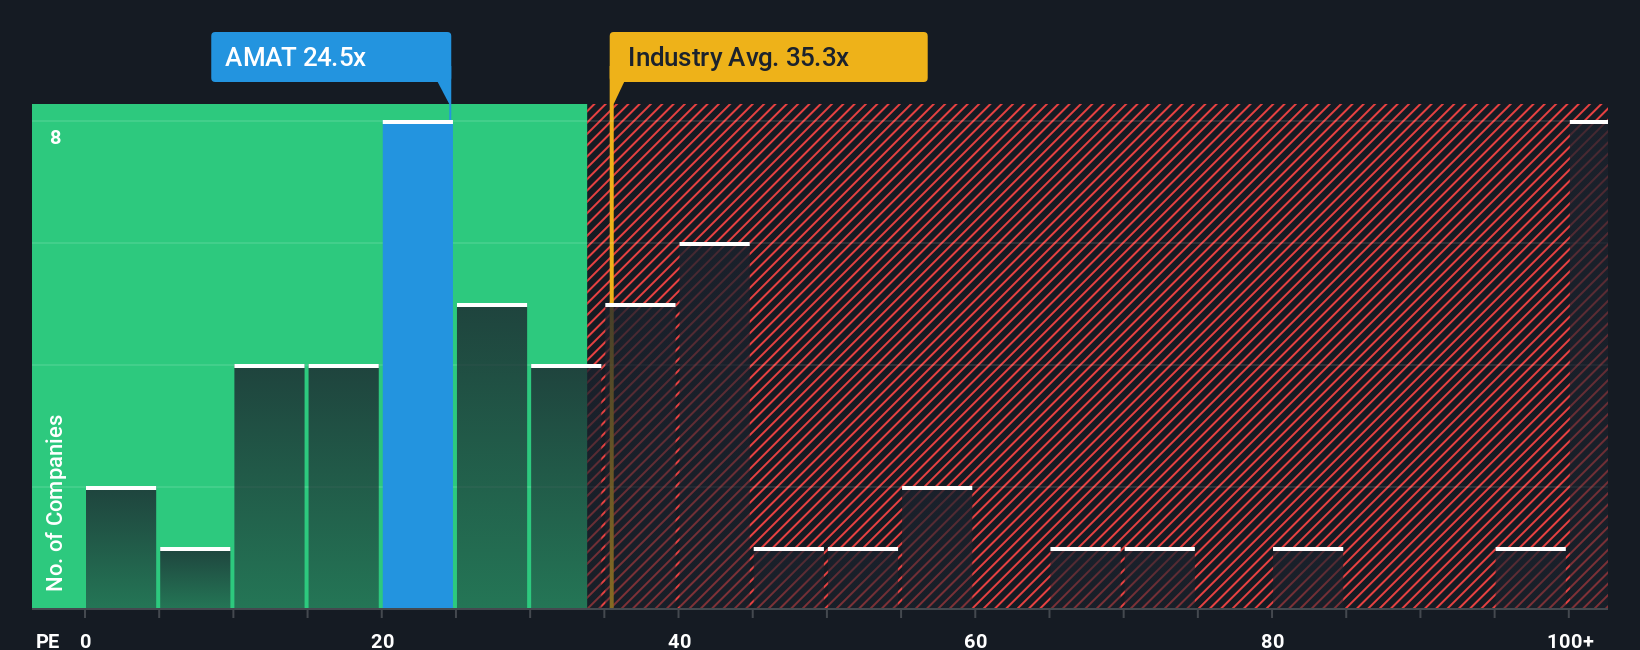
Applied Materials currently trades on a P/E of 35.94x. That compares with an average P/E of 42.10x for the Semiconductor industry and a peer group average of 52.21x, so the stock sits below both of those reference points. Simply Wall St also calculates a Fair Ratio of 37.60x, which is the P/E it would expect for Applied Materials after accounting for factors such as its earnings growth profile, profit margins, industry, market value and key risks.
This Fair Ratio is more tailored than a simple peer or industry comparison because it adjusts for company specific characteristics rather than assuming all semiconductor names deserve the same multiple. Against that Fair Ratio, the current P/E of 35.94x is lower, which indicates the shares appear undervalued on this metric.
Result: UNDERVALUED
P/E ratios tell one story, but what if the real opportunity lies elsewhere? Start investing in legacies, not executives. Discover our 23 top founder-led companies.
Upgrade Your Decision Making: Choose your Applied Materials Narrative
Earlier we mentioned that there is an even better way to understand valuation, so let us introduce you to Narratives. These are simple stories you build around a company like Applied Materials, linking your view on its future revenue, earnings and margins to a forecast and then to a Fair Value. You can then compare this Fair Value with the current price on the Simply Wall St Community page, where Narratives are shared by millions of investors and update automatically when new information such as news or earnings is added. Narratives can differ widely. For example, one Applied Materials Narrative may point to a Fair Value of about US$190.00 while another points to roughly US$420.71. This gives you a clear, visual sense of how different assumptions can lead to very different views on whether the stock looks expensive or attractive on your terms.
For Applied Materials, however, we will make it really easy for you with previews of two leading Applied Materials Narratives:
Fair value in this narrative: US$398.73
Implied discount or premium vs last close of US$354.91: about 11.0% below that fair value
Assumed annual revenue growth used: 14.32%
- Analysts in this narrative link Applied Materials' materials engineering and advanced packaging exposure to AI, high performance computing and global fab buildouts, with a focus on a larger addressable market over time.
- They factor in higher assumed revenue growth, stronger profit margins and a richer future P/E multiple, which together lift their implied fair value estimate compared with earlier models.
- The story leans on recurring service revenues, a growing installed base and customer co development, while acknowledging risks such as export controls, customer concentration and rising competition.
Fair value in this narrative: US$194.11
Implied premium vs last close of US$354.91: about 82.9% above that fair value
Assumed annual revenue growth used: 7.0%
- This narrative still sees AI, data centers and government backed fab expansion as important demand drivers for equipment, but pairs that with reminders that semiconductor spending is cyclical.
- It anchors on more moderate revenue growth assumptions and a future P/E of 22.0x, while pointing to export controls on China, supply chain issues and geopolitical tensions as meaningful headwinds.
- The author highlights competition from other major equipment makers and flags that China exposure, capital expenditure swings and policy risk could all weigh on future returns for shareholders.
These two narratives show how different assumptions on growth, risks and the multiple investors might be willing to pay can lead to very different views on what Applied Materials is worth today. They are a useful starting point for you to stress test your own expectations against what other investors are currently thinking about the stock.
Do you think there's more to the story for Applied Materials? Head over to our Community to see what others are saying!
This article by Simply Wall St is general in nature. We provide commentary based on historical data and analyst forecasts only using an unbiased methodology and our articles are not intended to be financial advice. It does not constitute a recommendation to buy or sell any stock, and does not take account of your objectives, or your financial situation. We aim to bring you long-term focused analysis driven by fundamental data. Note that our analysis may not factor in the latest price-sensitive company announcements or qualitative material. Simply Wall St has no position in any stocks mentioned.