Assessing Guardant Health (GH) Valuation After New Colon Cancer ctDNA Study Publication
Guardant Health GH | 86.40 | +5.10% |
Why this new colon cancer study matters for Guardant Health (GH)
Guardant Health (GH) is back in focus after publishing, with Mayo Clinic and the Alliance for Clinical Trials in Oncology, the largest study so far using its Guardant Reveal blood test in resected stage III colon cancer.
The Journal of Clinical Oncology paper reports that Guardant Reveal detected circulating tumor DNA in about 20% of more than 2,000 patients after surgery, identifying a group with a four to six times higher rate of recurrence or reduced survival than standard staging alone.
Guardant Health's recent Journal of Clinical Oncology publication lands after a volatile stretch, with a 1 year total shareholder return of 129.03% and a 3 year total shareholder return of roughly 2.6x, while 7 day and 30 day share price returns have pulled back.
If this colon cancer study has you thinking more broadly about cancer diagnostics, you may want to explore other healthcare AI names using our screener of 26 healthcare AI stocks.
With the stock up 129% over the past year but showing recent pullbacks, and trading below some implied valuation estimates, should you view Guardant Health as still mispriced, or assume the market is already factoring in years of future growth?
Most Popular Narrative: 16% Undervalued
The most followed narrative puts Guardant Health's fair value at about $121.19 per share, compared with the last close of $101.85, and builds a detailed case around growth, margins, and long term cash generation.
Rapid integration of AI-powered clinical analytics and multi-omic profiling into Guardant's "Smart Liquid Biopsy" platform is creating new clinical applications, enhancing product utility and differentiation versus peers, which is leading to higher average selling prices (ASPs), rising margins, and increased potential for broader payer reimbursement and improved net margins.
Curious what earnings power is baked into that fair value? The narrative leans on fast top line expansion and a future profit margin shift that completely reshapes the math.
Result: Fair Value of $121.19 (UNDERVALUED)
However, the story could look very different if high R&D spending keeps cash burn elevated or if payer and guideline adoption for Shield and Reveal underwhelms.
Another View: Expensive On Sales, Even If Cash Flows Look Attractive
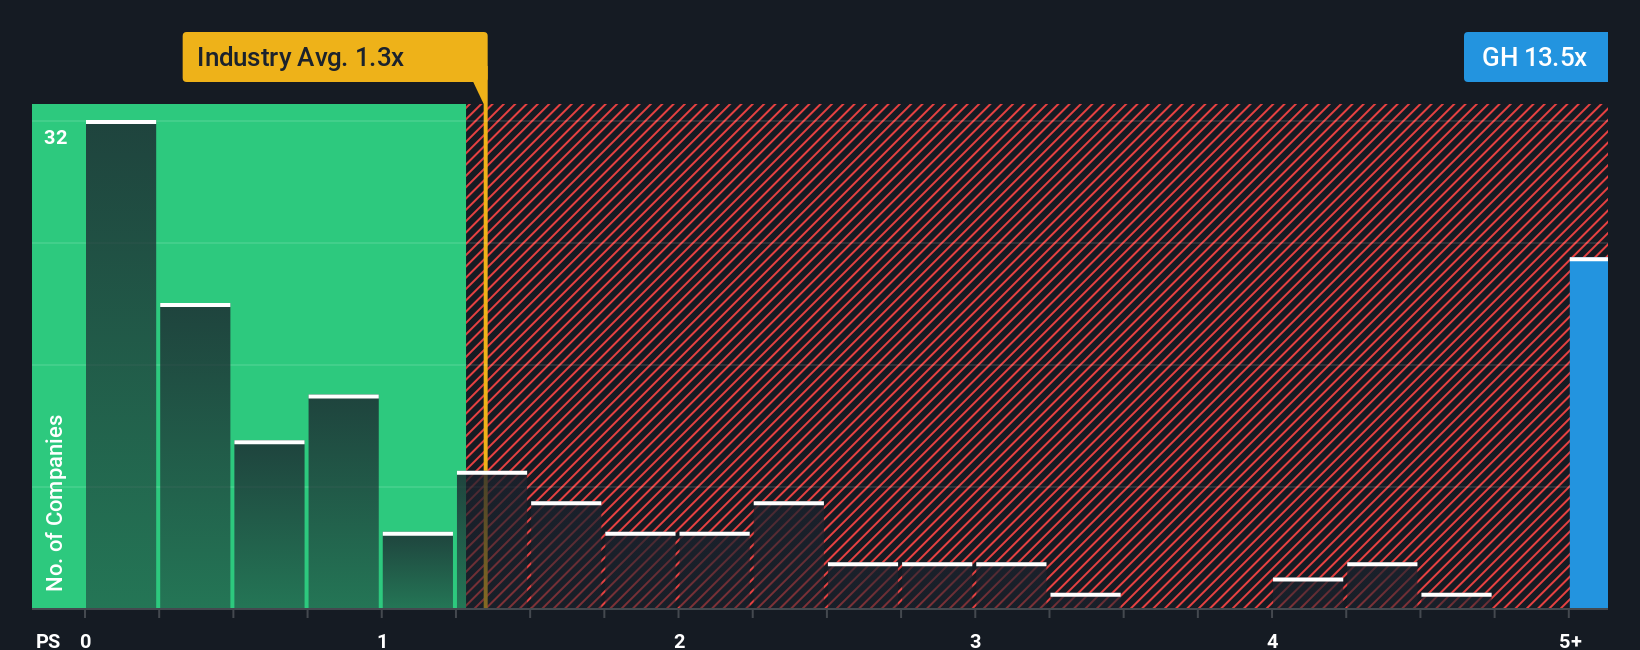
Here is the tension. Our DCF model suggests Guardant Health at $101.85 is trading about 34% below an estimated future cash flow value of $153.97, which points to upside. But the market is already paying a rich P/S of 14.5x versus 1.3x for the US Healthcare industry and 1.2x for peers, well above a fair ratio of 6.4x that the market could move toward. Is this a margin of safety, or is the bar simply set very high for future execution?
Build Your Own Guardant Health Narrative
If you are not fully on board with these assumptions, or simply want to put your own data view to the test, you can build a custom Guardant Health thesis in a few minutes, starting with Do it your way.
A great starting point for your Guardant Health research is our analysis highlighting 2 key rewards and 3 important warning signs that could impact your investment decision.
Looking for more investment ideas?
If Guardant Health has sharpened your thinking, do not stop here. Use the Simply Wall St Screener to spot other opportunities that could fit your approach.
- Target potential mispricings by running your rules across our list of 52 high quality undervalued stocks that pair fundamental strength with appealing valuations.
- Prioritise resilience by focusing on 82 resilient stocks with low risk scores that score well on stability and downside protection.
- Hunt for fresh opportunities before the crowd notices them by scanning our screener containing 24 high quality undiscovered gems with strong underlying fundamentals.
This article by Simply Wall St is general in nature. We provide commentary based on historical data and analyst forecasts only using an unbiased methodology and our articles are not intended to be financial advice. It does not constitute a recommendation to buy or sell any stock, and does not take account of your objectives, or your financial situation. We aim to bring you long-term focused analysis driven by fundamental data. Note that our analysis may not factor in the latest price-sensitive company announcements or qualitative material. Simply Wall St has no position in any stocks mentioned.