Assessing Immatics (NasdaqCM:IMTX) Valuation After FDA Orphan Drug Designation For Its Melanoma Program
Immatics N.V. IMTX | 0.00 |
FDA orphan drug designation puts Immatics (NasdaqCM:IMTX) melanoma program in focus
Immatics (NasdaqCM:IMTX) is back on investor radars after the FDA granted orphan drug designation to its melanoma treatment for HLA-A 02:01-positive patients with Stage II and higher disease.
The orphan drug news lands after a sharp shift in sentiment, with the 1-year total shareholder return of 102.17% and recent 7-day and 30-day share price returns of 9.74% and 11.90% suggesting momentum is rebuilding despite a modest year to date share price decline of 1.91%.
If this kind of biotech catalyst has caught your attention, it could be a good moment to look across the sector and see what stands out in our 25 healthcare AI stocks.
With a 1 year total return above 100%, revenue of €84.757m alongside a net loss of €119.994m, and a price target implying a large gap to the last close of US$10.25, is there still a buying opportunity here, or is the market already pricing in future growth?
Preferred Price-to-Sales of 13.7x: Is it justified?
Right now, Immatics is trading on a P/S of 13.7x, which looks expensive compared to both its peers and what the data suggests could be a more grounded level.
The P/S multiple compares the company’s market value to its revenue, so for a clinical stage biotech like Immatics, it effectively reflects what investors are willing to pay today for each dollar of current sales while they wait on future pipeline outcomes.
For Immatics, that 13.7x P/S sits above the US Biotechs industry average of 12.3x and also above a peer group average of 12x, which points to the market assigning a premium. In addition, the estimated fair P/S ratio of 1.2x indicates a very large gap between the current valuation and where the SWS fair ratio model suggests the multiple could move if expectations cooled.
Result: Price-to-Sales of 13.7x (OVERVALUED)
However, the sizeable net loss of €119.994m and clinical execution risk across multiple early stage programs could challenge the current premium P/S and the recent sentiment shift.
Another way to look at value
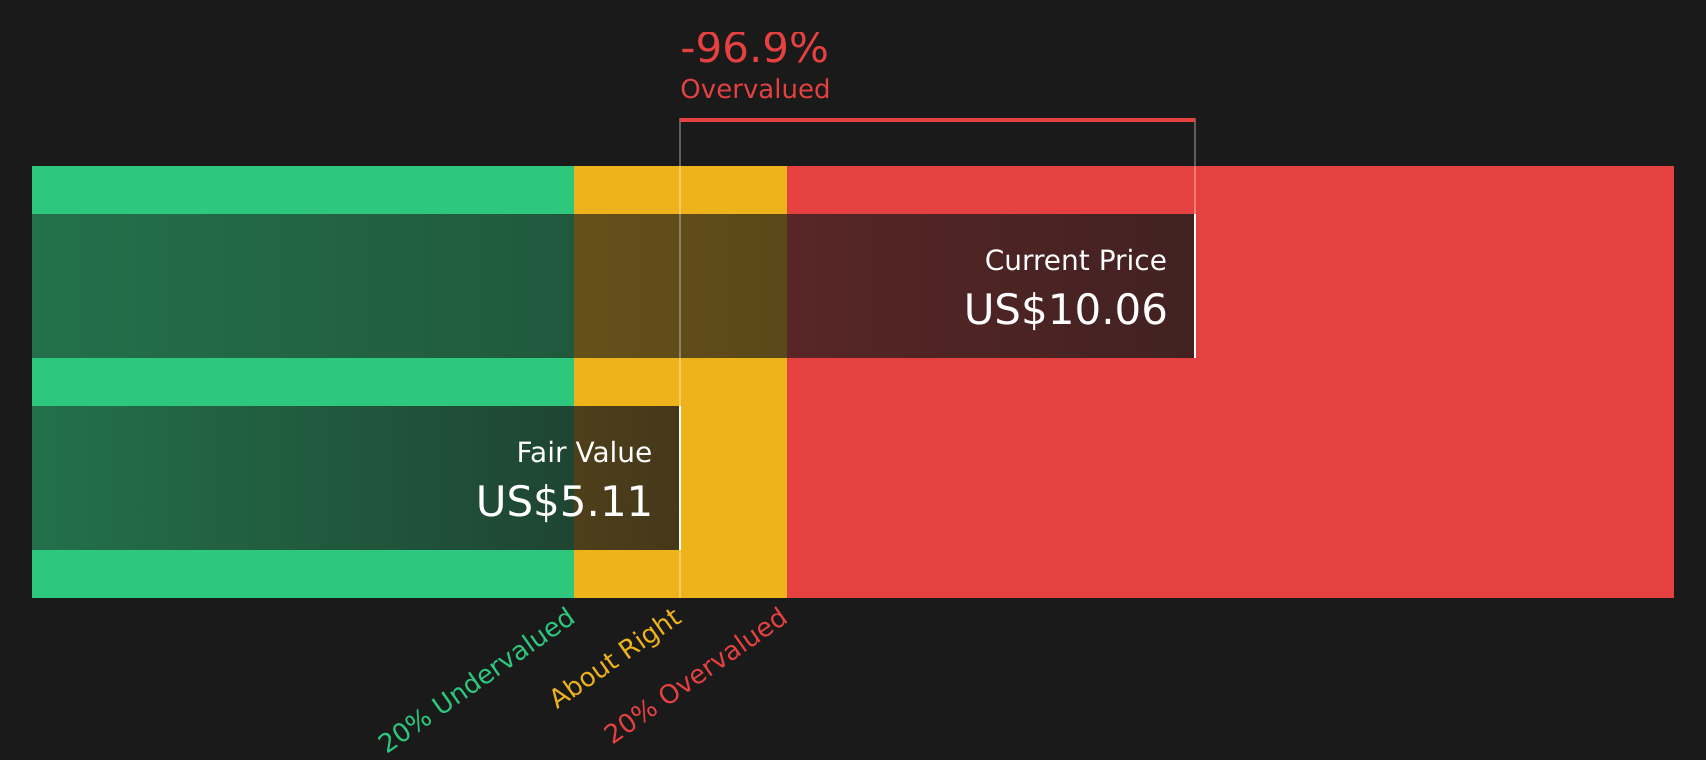
Our DCF model presents a similar picture to the rich 13.7x P/S multiple. On this view, Immatics at $10.25 is trading above an estimated future cash flow value of $4.97, which suggests the stock may be expensive rather than a bargain. So what exactly is the market paying up for?
Simply Wall St performs a discounted cash flow (DCF) on every stock in the world every day (check out Immatics for example). We show the entire calculation in full. You can track the result in your watchlist or portfolio and be alerted when this changes, or use our stock screener to discover 51 high quality undervalued stocks. If you save a screener we even alert you when new companies match - so you never miss a potential opportunity.
Build Your Own Immatics Narrative
If you see the numbers differently or want to stress test your own thesis, you can create a personalized Immatics story in just a few minutes by starting with Do it your way.
A great starting point for your Immatics research is our analysis highlighting 1 key reward and 2 important warning signs that could impact your investment decision.
Ready for more investment ideas?
If Immatics has sharpened your appetite for opportunities, do not stop here. Use the Simply Wall St screener to compare other ideas before the market moves without you.
- Target quality at a discount by checking companies our screener flags as 51 high quality undervalued stocks with strong fundamentals and room for further research.
- Prioritise resilience by reviewing businesses in the 85 resilient stocks with low risk scores that pair lower risk scores with more robust profiles.
- Spot earlier opportunities by scanning the screener containing 24 high quality undiscovered gems where solid financials may not yet be widely followed.
This article by Simply Wall St is general in nature. We provide commentary based on historical data and analyst forecasts only using an unbiased methodology and our articles are not intended to be financial advice. It does not constitute a recommendation to buy or sell any stock, and does not take account of your objectives, or your financial situation. We aim to bring you long-term focused analysis driven by fundamental data. Note that our analysis may not factor in the latest price-sensitive company announcements or qualitative material. Simply Wall St has no position in any stocks mentioned.