Assessing Murphy USA (MUSA) Valuation As Shares Pull Back After Strong Multi Year Run
Murphy USA, Inc. MUSA | 0.00 |
Murphy USA stock at a glance
Murphy USA (MUSA) is in focus after recent trading left the stock at $515.68, with performance mixed, up over the past 3 years but down over the past month.
The recent pullback, including a 13.61% 1 month share price return and a weaker 7 day move, comes after strong momentum, with a 27.22% year to date share price return and 82.86% 3 year total shareholder return.
If you are comparing Murphy USA with other opportunities, this could be a good moment to broaden your search and check out 20 top founder-led companies
With Murphy USA trading at $515.68, sitting close to analyst targets, and showing mixed recent returns, the key question is whether current pricing already reflects its fuel retail potential or if markets are underestimating its prospects.
Most Popular Narrative: 7.6% Undervalued
At $515.68, Murphy USA sits below the most widely followed narrative fair value of $558, setting up a debate over how much its fuel model is really worth.
Operational efficiencies and cost discipline, including lower store OpEx and SG&A achieved through technology and supply chain improvements, are structurally reducing expenses and driving higher net earnings, allowing the company to maintain profitability even in softer demand environments. Industry consolidation and ongoing competitive shakeout are supporting structurally higher fuel retail margins for scaled operators, as less efficient competitors exit the market, translating to improved long-term EBITDA and free cash flow generation.
Curious what kind of revenue growth, margin shifts, and future earnings multiple have to line up for that fair value to hold up. The narrative spells out a tight set of assumptions around top line, profitability, and valuation that many investors may find surprisingly punchy.
Result: Fair Value of $558 (UNDERVALUED)
However, this depends on fuel volumes and non fuel contribution not weakening further, and on new store openings avoiding the delays and underperformance analysts have flagged.
Another View: Cash Flow Paints A Different Picture
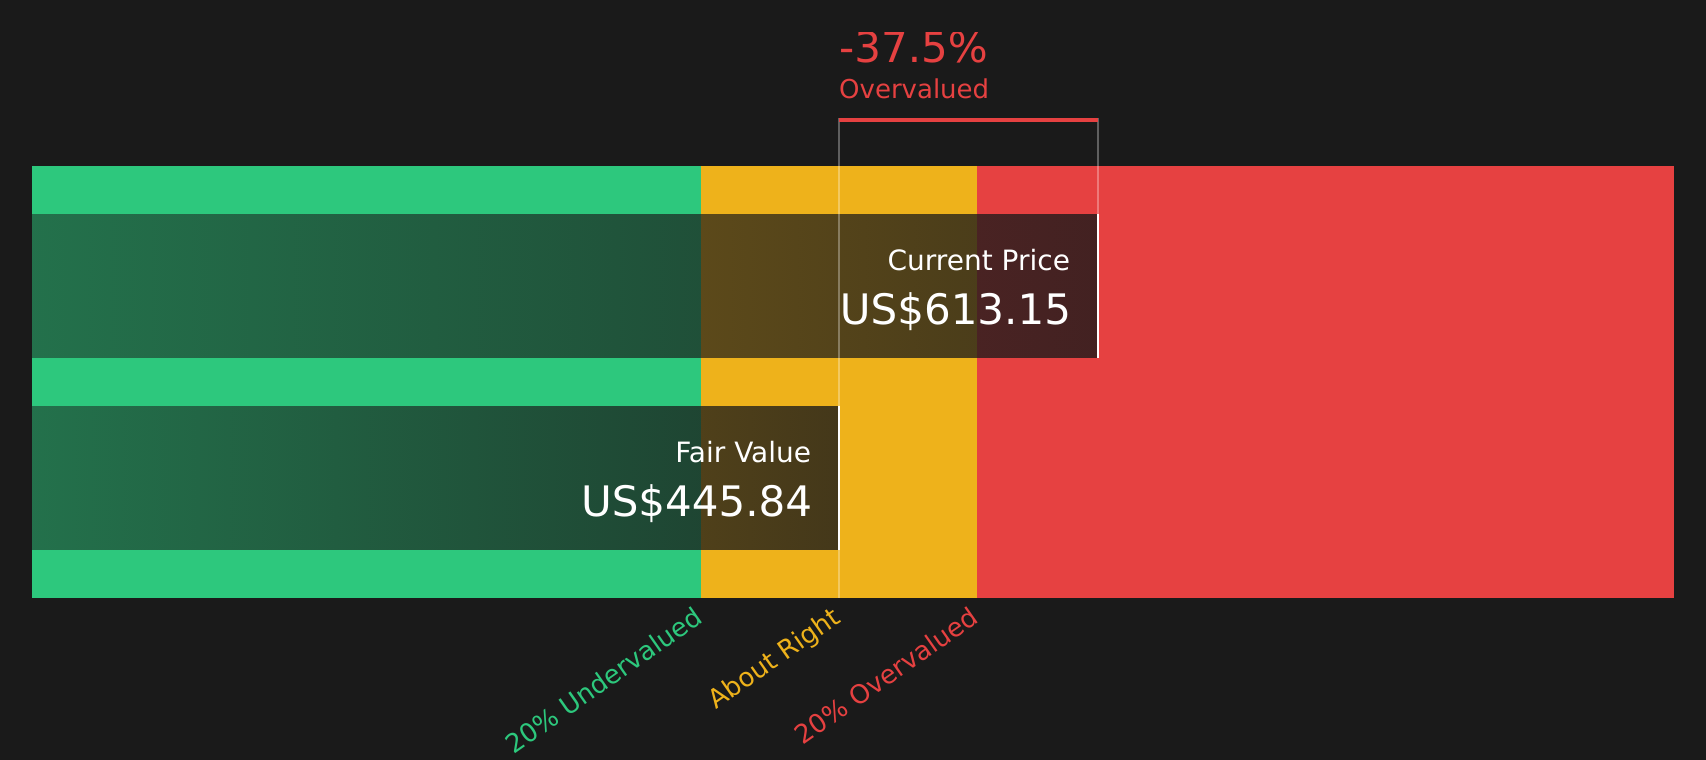
While the analyst narrative sees Murphy USA as 7.6% undervalued at $515.68 versus a $558 fair value, the Simply Wall St DCF model points the other way, with a future cash flow value of $409.97 and the stock trading above that level. This raises the question of whether expectations have already gone too far.
Simply Wall St performs a discounted cash flow (DCF) on every stock in the world every day (check out Murphy USA for example). We show the entire calculation in full. You can track the result in your watchlist or portfolio and be alerted when this changes, or use our stock screener to discover 47 high quality undervalued stocks. If you save a screener we even alert you when new companies match - so you never miss a potential opportunity.
Next Steps
If this mix of optimism and concern feels familiar, that is the point. Tension like this is where your own judgment matters most, so check the numbers, question the assumptions, and weigh the 2 key rewards and 3 important warning signs.
Ready for more investment ideas?
If Murphy USA has sharpened your thinking, do not stop here. A few focused screeners can surface other stocks that fit the kind of portfolio you want.
- Target quality at a discount by reviewing companies picked out as 47 high quality undervalued stocks.
- Prioritise resilience by scanning stocks in the 62 resilient stocks with low risk scores.
- Spot future standouts early by checking the screener containing 22 high quality undiscovered gems.
This article by Simply Wall St is general in nature. We provide commentary based on historical data and analyst forecasts only using an unbiased methodology and our articles are not intended to be financial advice. It does not constitute a recommendation to buy or sell any stock, and does not take account of your objectives, or your financial situation. We aim to bring you long-term focused analysis driven by fundamental data. Note that our analysis may not factor in the latest price-sensitive company announcements or qualitative material. Simply Wall St has no position in any stocks mentioned.