Assessing Nvidia (NVDA) Valuation After Recent Pullback And Conflicting Fair Value Signals
NVIDIA Corporation NVDA | 0.00 |
Recent performance snapshot
NVIDIA (NVDA) has seen mixed share performance recently, with the stock down 6.2% over the past day, down 2.9% over the past week, and down 3.0% over the past month, while still up 15.3% over the past 3 months.
The recent pullback, with the latest share price at US$205.10 and short term share price returns softening, contrasts with very strong 1 year and multi year total shareholder returns. This points to investors still pricing in significant AI infrastructure potential and risk.
If NVIDIA has you thinking about where else AI demand could flow, it may be worth scanning other potential beneficiaries using our screener for 48 AI infrastructure stocks
With NVIDIA now at US$205.10 after a strong multi year run, revenue of US$253.5b and net income of US$159.6b, should you view temporary weakness as a potential opening, or assume markets are already pricing in future growth?
Most Popular Narrative: 39.7% Undervalued
At a last close of $205.10 versus a narrative fair value of $339.90, the most followed view on NVIDIA points to a large gap between market price and projected potential.
Nvidia will hit $400b annual revenue in 5 years time. ~90% of revenue will come from data centre customers. This equates to $90b / quarter, or equivalent to 30,000 Blackwell racks (at ~$3m per rack).
Curious how that revenue outlook feeds into the fair value? The narrative leans on aggressive data center demand, rich margins and a premium earnings multiple. The exact mix might surprise you.
Result: Fair Value of $339.90 (UNDERVALUED)
However, this hinges on NVIDIA maintaining AI software dominance and premium pricing power, while avoiding regulatory or geopolitical shocks that could curb data center demand.
Wall Street's queuing for one rocket. While SpaceX counts down to its IPO, other companies tied to the new space race are already in orbit. → 20 Compelling Space Companies watchlist · Global Space Race Investing Ideas screener · Scan the sector by valuation on Rocket Lab's valuation page.
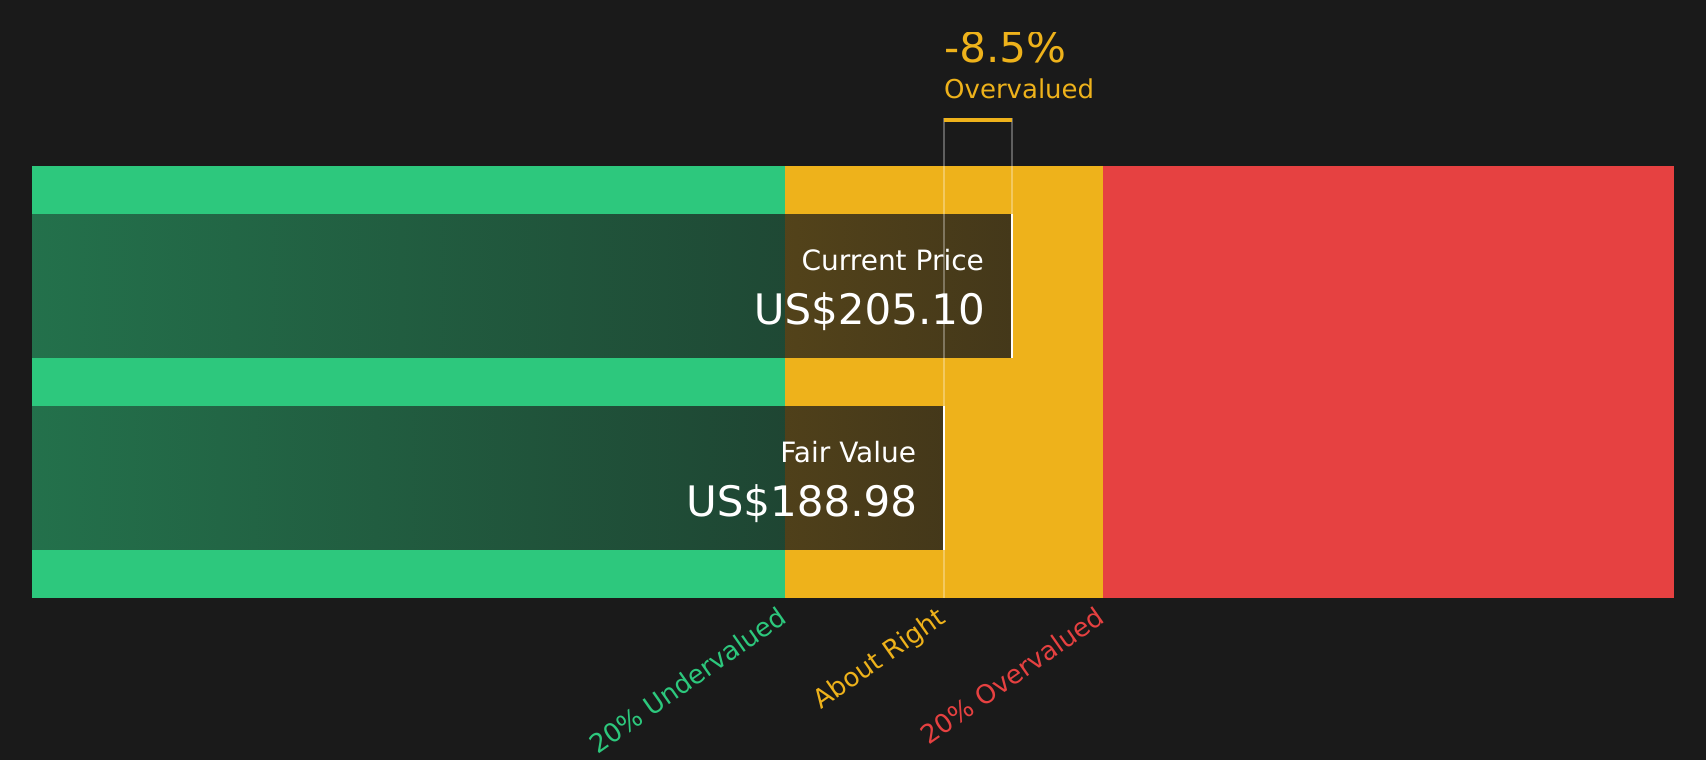
Another view: cash flows paint a tighter picture
While the most followed narrative points to a fair value of $339.90, our DCF model points to a future cash flow value of $188.98, which sits below the current $205.10 share price and implies NVIDIA is trading above that estimate.
This gap between narrative driven upside and the SWS DCF model’s more cautious output raises a simple question for you: which set of assumptions feels closer to how NVIDIA might actually convert AI demand into long term cash flows, and how much valuation risk are you comfortable carrying?
Simply Wall St performs a discounted cash flow (DCF) on every stock in the world every day (check out NVIDIA for example). We show the entire calculation in full. You can track the result in your watchlist or portfolio and be alerted when this changes, or use our stock screener to discover 49 high quality undervalued stocks. If you save a screener we even alert you when new companies match - so you never miss a potential opportunity.
Next Steps
With sentiment clearly split between upside potential and valuation risk, it makes sense to check the underlying data yourself and move quickly to shape your own view by weighing the 4 key rewards and 2 important warning signs.
Looking for more investment ideas?
If NVIDIA is already on your radar, do not stop there. Broader opportunities could be sitting in plain sight, and skipping them might cost you future options.
- Spot potential bargains before the crowd by scanning companies our models flag as strong value candidates using the 49 high quality undervalued stocks.
- Strengthen your income game by checking out companies offering robust yields and payout profiles through the 9 dividend fortresses.
- Prioritise resilience by focusing on companies with healthier finances and lower risk scores via the 64 resilient stocks with low risk scores.
This article by Simply Wall St is general in nature. We provide commentary based on historical data and analyst forecasts only using an unbiased methodology and our articles are not intended to be financial advice. It does not constitute a recommendation to buy or sell any stock, and does not take account of your objectives, or your financial situation. We aim to bring you long-term focused analysis driven by fundamental data. Note that our analysis may not factor in the latest price-sensitive company announcements or qualitative material. Simply Wall St has no position in any stocks mentioned.