Baker Hughes (BKR) Stock After Recent Pullback Is There Still Upside Potential
Baker Hughes BKR | 0.00 |
With Baker Hughes back on your radar, the key question is simple: at around US$58.68 per share, does the current price still reflect good value, or has the easy part of the story already played out?
Despite the stock being down 4.6% over the past week and 11.2% over the past month, Baker Hughes is still up 24.5% year to date and 57.2% over the past year. That naturally raises questions about how much of the opportunity is already priced in and how risk perceptions may be shifting.
Recent headlines around Baker Hughes have focused on its role as a major energy services provider and ongoing interest in companies tied to global energy and infrastructure spending. This helps explain why the stock remains in focus even after sharp moves. Together, this mix of shorter term pullbacks and strong multi year returns, including a gain of over 100% across three years and well over that across five years, provides important context for assessing whether today’s valuation still makes sense.
On Simply Wall St’s 6 point valuation checklist, Baker Hughes scores a full 6 out of 6, which suggests that, by those measures, the stock screens as undervalued across every check. The sections that follow break down the key valuation approaches behind that score and then finish with a way to look beyond the numbers to understand how the valuation links to the broader investment story.
Approach 1: Baker Hughes Discounted Cash Flow (DCF) Analysis
A Discounted Cash Flow model takes projected future cash flows and discounts them back to today using a required rate of return, giving an estimate of what Baker Hughes stock could be worth based on its ability to generate cash.
For Baker Hughes, the latest twelve month free cash flow is about $2.3b. Simply Wall St uses a 2 Stage Free Cash Flow to Equity model, which incorporates analyst forecasts for the next few years and then extrapolates further cash flows. Under this approach, projected free cash flow reaches about $3.7b by 2030, with a series of annual cash flows between 2026 and 2035 discounted back to today.
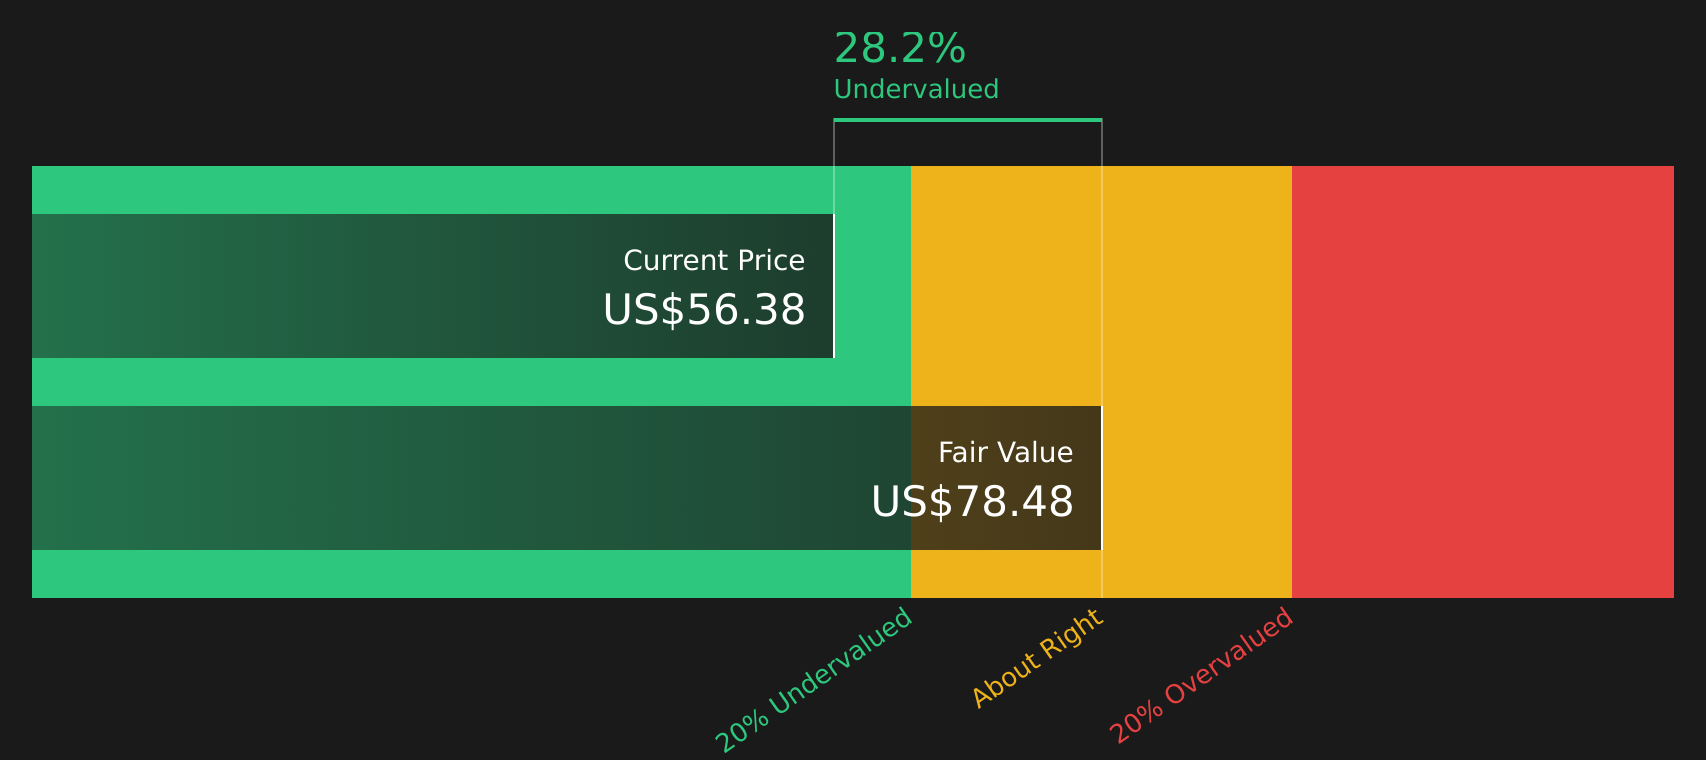
Adding up all of those discounted cash flows produces an estimated intrinsic value of $78.51 per share. Compared to the recent share price of about $58.68, the DCF output suggests Baker Hughes trades at roughly a 25.3% discount, so the stock screens as undervalued on this model.
Result: UNDERVALUED
Our Discounted Cash Flow (DCF) analysis suggests Baker Hughes is undervalued by 25.3%. Track this in your watchlist or portfolio, or discover 44 more high quality undervalued stocks.
Approach 2: Baker Hughes Price vs Earnings
For a profitable company like Baker Hughes, the P/E ratio is a useful way to relate what you are paying for the stock to the earnings it is currently generating. In simple terms, higher growth expectations and lower perceived risk usually support a higher “normal” P/E, while slower expected growth or higher risk tend to justify a lower one.
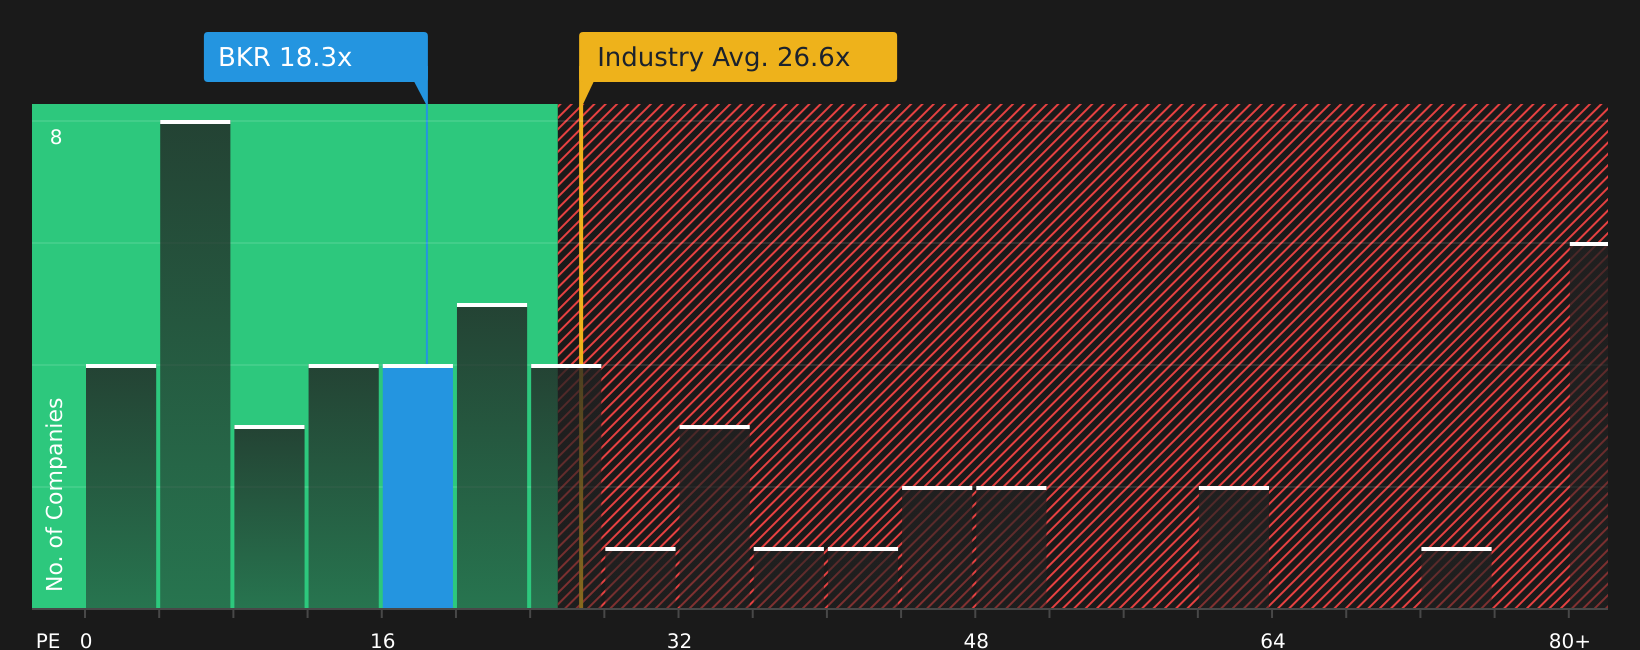
Baker Hughes trades on a P/E of about 18.68x. That compares with an Energy Services industry average of roughly 27.33x and a broader peer average of about 34.70x, so the stock is priced below these simple benchmarks. To go a step further, Simply Wall St calculates a proprietary “Fair Ratio” of 20.22x for Baker Hughes. This Fair Ratio reflects factors such as the company’s earnings growth profile, profit margins, industry, market cap and risk characteristics, rather than just lining it up against broad industry or peer groups.
Because the Fair Ratio incorporates these company specific inputs, it aims to provide a more tailored yardstick than a basic industry or peer comparison. With the current P/E of 18.68x sitting below the Fair Ratio of 20.22x, Baker Hughes screens as undervalued on this measure.
Result: UNDERVALUED
P/E ratios tell one story, but what if the real opportunity lies elsewhere? Start investing in legacies, not executives. Discover our 20 top founder-led companies.
Upgrade Your Decision Making: Choose your Baker Hughes Narrative
Earlier it was mentioned that there is an even better way to understand valuation, so Narratives on Simply Wall St let you link your view of Baker Hughes to a clear financial forecast and fair value, by writing out the story you believe in, tying it to assumptions for future revenue, earnings and margins. You can then compare that Fair Value to today’s price on the Community page, where it updates automatically when fresh news or earnings arrive. On this page, different investors may land anywhere from a bearish fair value near US$52.30 up toward a bullish view around US$80.00, depending on how confident they are in the company’s energy technology, LNG and data center opportunities.
For Baker Hughes however we'll make it really easy for you with previews of two leading Baker Hughes Narratives:
Fair value in this bullish narrative: US$80.00 per share
Implied discount to that fair value versus the recent US$58.68 share price: about 26.7%
Revenue growth assumption: 7.09%
- Emphasis on record IET orders, a large remaining performance obligation and a sizeable LNG and gas infrastructure backlog as the core supports for multi year revenue and earnings resilience.
- Focus on power systems and data center related contracts, digital solutions such as Cordant and Leucipa and higher return industrialized energy solutions as ways to support margins and cash generation.
- View that, if higher revenues, earnings of about US$3.6b and a P/E of 27.4x by around 2029 are achieved, a fair value of US$80.00 can be justified using a discount rate of about 7.4%.
Fair value in this bearish narrative: US$52.30 per share
Implied premium to that fair value versus the recent US$58.68 share price: about 12.2%
Revenue growth assumption: 1.50%
- Concern that reliance on LNG, gas infrastructure and data center driven power projects could leave Baker Hughes exposed if project approvals, export flows or data center demand slow.
- Focus on execution risk around the Chart acquisition, portfolio reshaping and targeted cost synergies, along with the possibility of softer margins if activity levels ease after the current investment wave.
- View that, if revenues reach about US$29.2b, earnings around US$2.6b and a P/E of 25.6x by 2029, a fair value of roughly US$52.30 is more appropriate when discounted at about 7.7%.
These two Baker Hughes narratives give you a clear range of assumptions to stress test against your own view of the company’s backlog quality, earnings power and appropriate valuation multiple.
Do you think there's more to the story for Baker Hughes? Head over to our Community to see what others are saying!

This article by Simply Wall St is general in nature. We provide commentary based on historical data and analyst forecasts only using an unbiased methodology and our articles are not intended to be financial advice. It does not constitute a recommendation to buy or sell any stock, and does not take account of your objectives, or your financial situation. We aim to bring you long-term focused analysis driven by fundamental data. Note that our analysis may not factor in the latest price-sensitive company announcements or qualitative material. Simply Wall St has no position in any stocks mentioned.