

Barrick Mining (B) After A 4% Jump Looks Cheap On A 10x P E
Barrick Mining B | 0.00 |
Recent Share Performance Sets the Stage for Barrick Mining Stock Discussion
Barrick Mining (B) has drawn attention after a recent 1 day gain of about 4.2%, following a period in which the stock declined around 9.8% over the past month and 10.7% over the past 3 months.
For context, Barrick Mining's share price is at US$36.37 after the recent 1 day gain, but the stock is still down over the year to date. Longer term total shareholder returns over 1, 3 and 5 years have been strongly positive, which suggests recent momentum has cooled compared with its longer run performance and may reflect shifting views on its growth potential and risk profile.
If you are comparing Barrick Mining with other gold producers, this is a useful moment to see what else is on the move and review the 33 elite gold producer stocks.
After Barrick Mining's sharp swing, the real test is whether the current price still offers enough potential upside to justify the risks. To answer that, the next step is to run through the valuation.
Price-to-Earnings of 10x: Is it justified?
On a simple P/E basis, Barrick Mining looks cheap, with the stock at $36.37 trading on about 10x earnings while multiple checks suggest the market is pricing it below peers and below an estimated fair level.
The P/E ratio compares the current share price to earnings per share, so for a miner like Barrick Mining it is a quick way to see how much investors are paying for each dollar of profit. A lower P/E can signal that the market is cautious about future earnings, or that expectations are more muted compared with higher rated metals and mining stocks.
Here, several indicators point in the same direction. Barrick Mining is described as trading at good value compared to peers and the wider industry, and its P/E of 10x sits below the US market average P/E of 19.2x. It is also framed as good value against an estimated fair P/E of 22.1x, which is more than double the current multiple and suggests the valuation could shift if sentiment moved closer to that fair ratio level.
The gap is just as clear against sector benchmarks, with Barrick Mining's 10x P/E below the US Metals and Mining industry average of 17.3x and below a peer group average P/E of 15.6x. This reinforces the idea that the stock is priced at a discount to comparable companies on reported earnings.
Result: Price-to-Earnings of 10x (UNDERVALUED)
However, Barrick Mining's recent share price weakness, together with an intrinsic value estimate that sits above the current price, both highlight that sentiment can turn quickly if earnings or commodity conditions disappoint.
Another View on Barrick Mining's Valuation
The P/E comparison makes Barrick Mining look inexpensive, but the SWS DCF model points in the opposite direction. With the stock at $36.37 versus an estimated future cash flow value of $32.40, this approach suggests the shares are slightly overvalued. Which signal should carry more weight in your process?
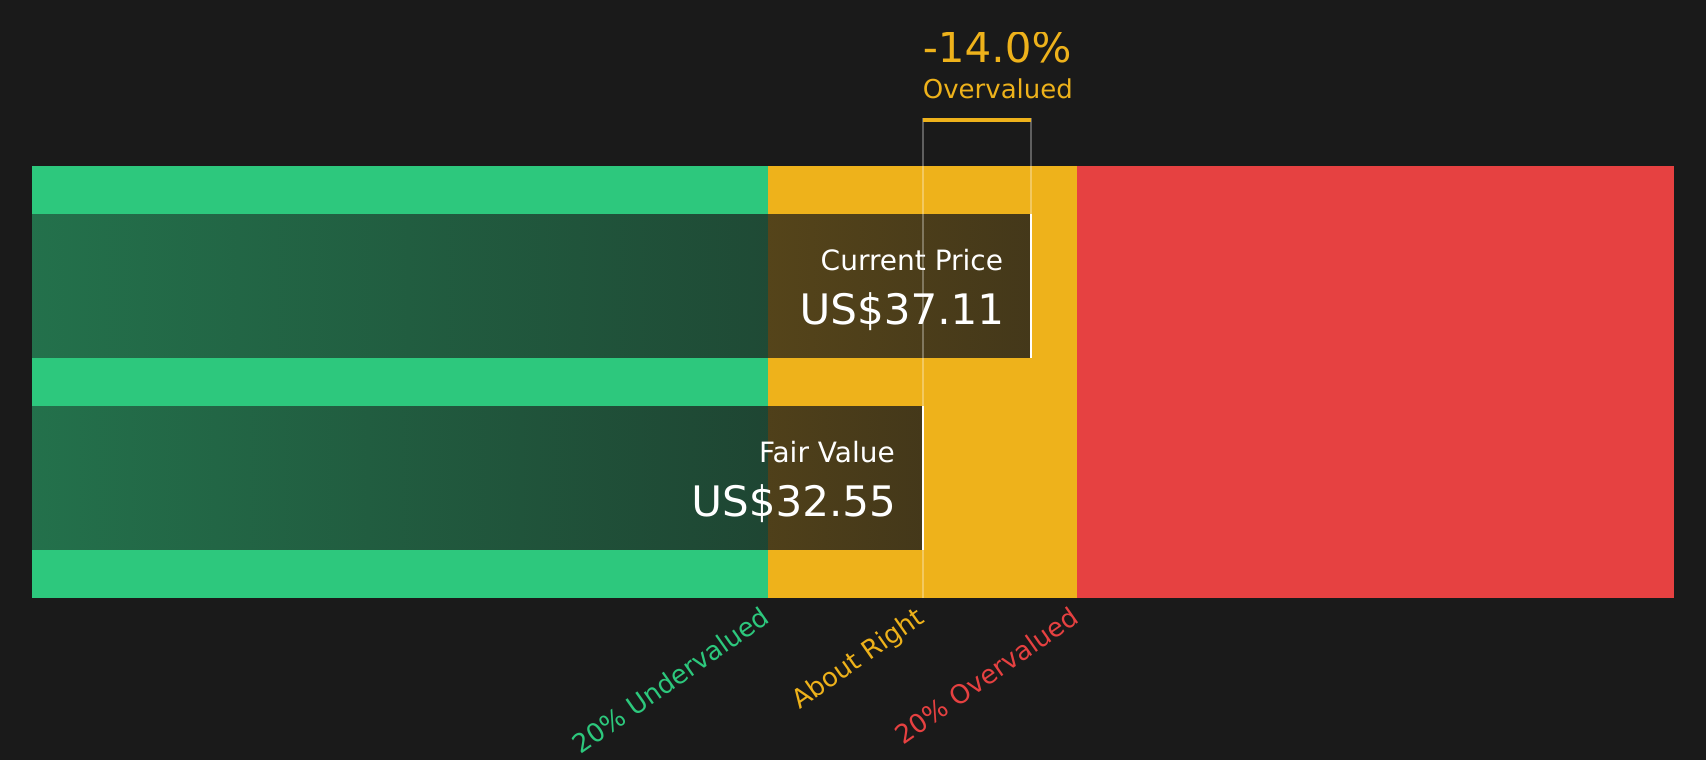
Simply Wall St performs a discounted cash flow (DCF) on every stock in the world every day (check out Barrick Mining for example). We show the entire calculation in full. You can track the result in your watchlist or portfolio and be alerted when this changes, or use our stock screener to discover 50 high quality undervalued stocks. If you save a screener we even alert you when new companies match - so you never miss a potential opportunity.
Next Steps
The mixed signals around Barrick Mining's valuation and sentiment will not interpret themselves. Act quickly, review the data, and weigh up the 4 key rewards and 2 important warning signs.
Looking for more investment ideas beyond Barrick Mining?
If Barrick Mining has caught your attention, do not stop there. Broaden your watchlist now so you are not late to the next opportunity.
- Target quality at a discount by scanning companies that look mispriced on fundamentals through the 50 high quality undervalued stocks.
- Strengthen your income stream by checking out businesses offering reliable yields in the 9 dividend fortresses.
- Prioritise resilience by focusing on companies with robust finances using the solid balance sheet and fundamentals stocks screener (48 results).
This article by Simply Wall St is general in nature. We provide commentary based on historical data and analyst forecasts only using an unbiased methodology and our articles are not intended to be financial advice. It does not constitute a recommendation to buy or sell any stock, and does not take account of your objectives, or your financial situation. We aim to bring you long-term focused analysis driven by fundamental data. Note that our analysis may not factor in the latest price-sensitive company announcements or qualitative material. Simply Wall St has no position in any stocks mentioned.