

Berkshire Hathaway (BRK.B) Stock Looks Like A Bargain Despite Earnings Caution
Berkshire Hathaway Inc. Class B BRK.B | 0.00 |
Berkshire Hathaway stock is being priced by the market below what several valuation checks suggest it could be worth, even after a strong multi year share price run. This raises the question of whether investors are being too cautious about the post Buffett capital allocation era under Greg Abel.
- Berkshire Hathaway has returned 77.8% over the past 5 years, which points to solid long term wealth creation for shareholders.
- Greg Abel’s recent push to deploy Berkshire’s large cash pile into share buybacks and new equity investments can support the intrinsic value case, while execution risks around capital allocation and a relatively untested top team may limit how much of that value the market is willing to price in.
- The stock screens as undervalued on 5 of 6 Simply Wall St checks, which means the broader valuation work leans toward Berkshire Hathaway being cheap on fundamentals compared to its current share price 5.
The issue now is whether Berkshire Hathaway’s recent cash deployment and leadership transition are enough for the current share price to close the gap to the intrinsic value estimate, or if the discount could persist.
Does Berkshire Hathaway Look Undervalued on Excess Returns?
The Excess Returns model examines how much profit Berkshire Hathaway is expected to generate above its cost of equity and then links that to long term growth in book value. For Berkshire Hathaway, the key input is a stable earnings power estimate rather than a detailed cash flow path.
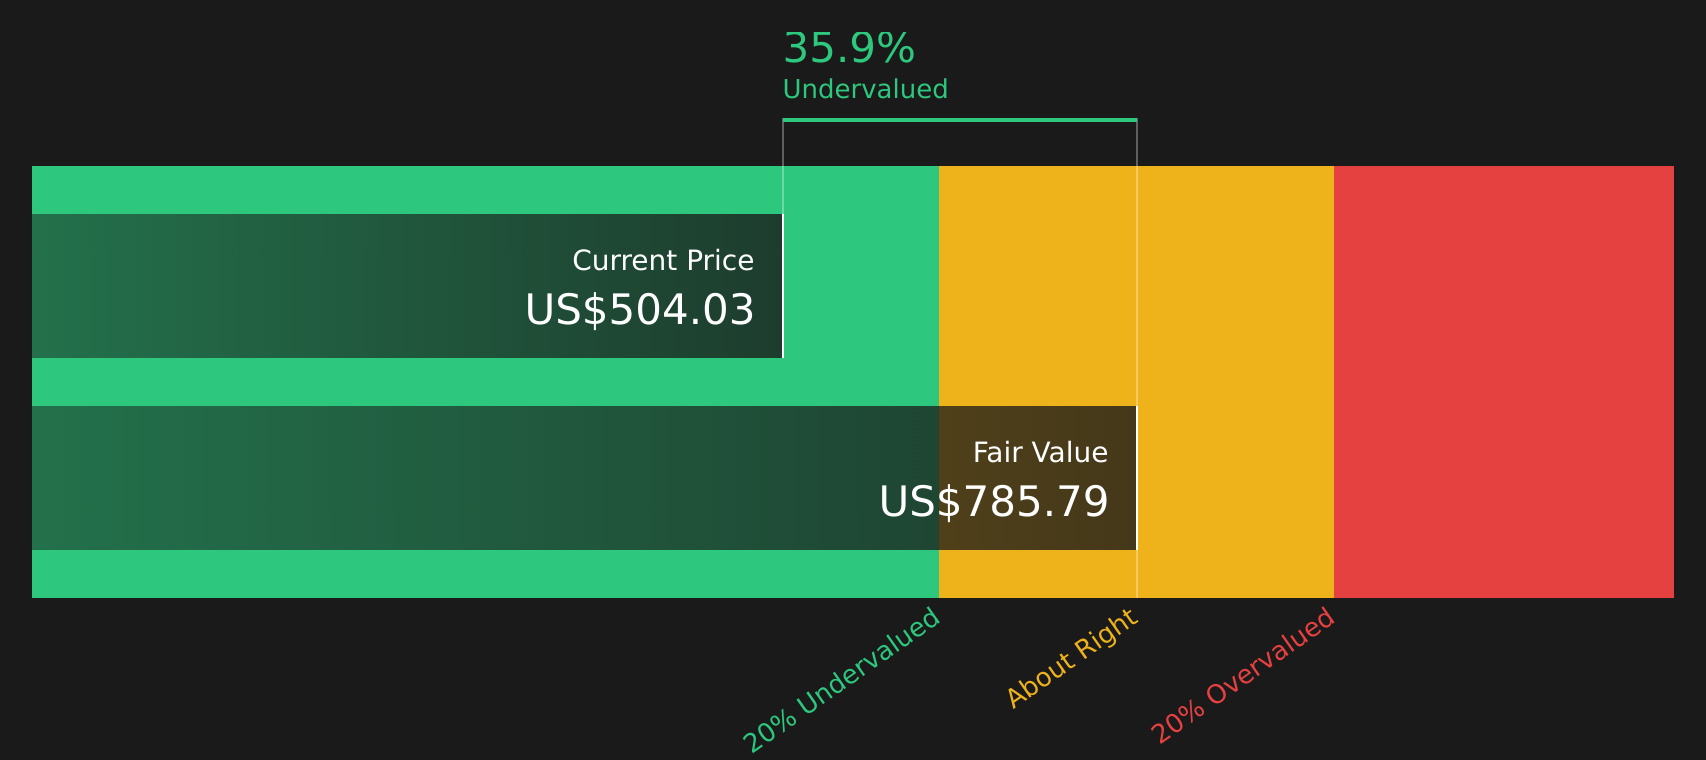
The model uses a book value of $522,225.90 per share and a stable EPS of $65,244.04 per share, based on the median return on equity from the past 5 years. With an average return on equity of 11.91% and a cost of equity of $41,063.92 per share, that implies excess return of $24,180.12 per share and a stable book value of $547,710.90 per share from analyst estimates. This supports an intrinsic value estimate of $787.98 per share, which indicates the stock is trading at a 35.7% discount relative to its current share price.
Because Greg Abel has begun putting Berkshire Hathaway’s cash reserve to work through buybacks and new equity investments, the market price remains below the level that the Excess Returns model suggests could be justified by those reinvested profits.
On these assumptions, Berkshire Hathaway stock currently screens as undervalued relative to its estimated intrinsic value.
Our Excess Returns analysis suggests Berkshire Hathaway is undervalued by 35.7%. Track this in your watchlist or portfolio, or discover 51 more high quality undervalued stocks.
Is Berkshire Hathaway Still Cheap on Earnings?
P/E is a useful lens for Berkshire Hathaway because the conglomerate still centers a lot of its value on recurring operating earnings. Right now the stock trades on a P/E of about 12.7x. This sits below both the Diversified Financial industry average of roughly 16.9x and the peer group average of 23.5x.
The fair P/E ratio implied by Simply Wall St’s model is 16.6x. That figure reflects what investors might typically pay for Berkshire Hathaway given its size, earnings profile and risk factors. Compared with the current 12.7x, the market is pricing the stock at a sizeable discount to that fair multiple, even after Greg Abel’s recent cash deployment and buybacks.
On this P/E comparison, Berkshire Hathaway stock appears undervalued relative to what the earnings profile would usually command.

The Berkshire Hathaway Narrative: What Would Justify Today's Price?
Simply Wall St Narratives take Berkshire Hathaway's valuation puzzle and turn it into concrete scenarios that explain what would need to happen to future growth, margins and earnings for the stock to be worth materially more or less than today's price. Each narrative connects its figures to a clear view of how Berkshire Hathaway's growth, profitability and risks could evolve, which you can revisit on the Community page as new information emerges.
You can be one of the first voices in the Simply Wall St community to set out a clear, number driven Narrative on Berkshire Hathaway that weighs in on whether Greg Abel’s recent cash deployment and large equity investments deliver on their potential. Share your view, put some figures around it and track how your thesis holds up as new results and capital allocation moves come through.
Do you think there's more to the story for Berkshire Hathaway? Head over to our Community to see what others are saying!
The Bottom Line
Berkshire Hathaway screens as undervalued on both the Excess Returns intrinsic value estimate and the P/E multiple, with each method pointing to a meaningful discount to current estimates of worth. The core question is whether Greg Abel and the broader leadership team can keep deploying the cash pile in a way that sustains those excess returns. If that capital allocation story holds together, the gap between price and intrinsic value could narrow over time. If execution disappoints, the current discount may prove to be the market correctly pricing that risk.
This article by Simply Wall St is general in nature. We provide commentary based on historical data and analyst forecasts only using an unbiased methodology and our articles are not intended to be financial advice. It does not constitute a recommendation to buy or sell any stock, and does not take account of your objectives, or your financial situation. We aim to bring you long-term focused analysis driven by fundamental data. Note that our analysis may not factor in the latest price-sensitive company announcements or qualitative material. Simply Wall St has no position in any stocks mentioned.