Can Nike (NKE) Recover After Multi‑Year Share Price Slump?
NIKE, Inc. Class B NKE | 0.00 |
- Wondering whether NIKE at around US$45.93 is a bargain or a value trap? This article walks through the key numbers so you can judge the stock's price tag with more confidence.
- The stock has inched up about 2.8% over the last week and 3.4% over the last month, but remains down 27.4% year to date and down 23.4% over the past year, which may change how you think about risk and potential upside.
- Those mixed returns sit against a longer backdrop where the share price is down 53.5% over three years and down 62.8% over five years, which is a big shift for a global consumer brand. For long term holders, that kind of performance can reset expectations and raise questions about how much of the bad news is already reflected in the price.
- On Simply Wall St's valuation checks, NIKE currently scores 0 out of 6. The next sections will compare what different valuation methods say about the stock today, and then circle back to an even better way to think about value at the end of the article.
NIKE scores just 0/6 on our valuation checks. See what other red flags we found in the full valuation breakdown.
Approach 1: NIKE Discounted Cash Flow (DCF) Analysis
A Discounted Cash Flow, or DCF, model takes estimates of the cash a company could generate in the future and discounts those cash flows back to today to arrive at an estimate of what the business might be worth now.
For NIKE, the model used is a 2 Stage Free Cash Flow to Equity approach based on cash flow projections. The latest twelve months Free Cash Flow is about $1.04b. Analysts provide forecasts out to 2030, with projected Free Cash Flow of $3.91b in that year, and Simply Wall St extrapolates further cash flows beyond the analyst horizon to complete the model.
When all those projected cash flows are discounted back to today, the DCF model arrives at an estimated intrinsic value of about $41.56 per share. Taking a current share price around $45.93 as a reference point, the model suggests the stock is about 10.5% more expensive than this cash flow based estimate. On this measure, NIKE screens as slightly overvalued rather than a clear bargain.
Result: OVERVALUED
Our Discounted Cash Flow (DCF) analysis suggests NIKE may be overvalued by 10.5%. Discover 47 high quality undervalued stocks or create your own screener to find better value opportunities.

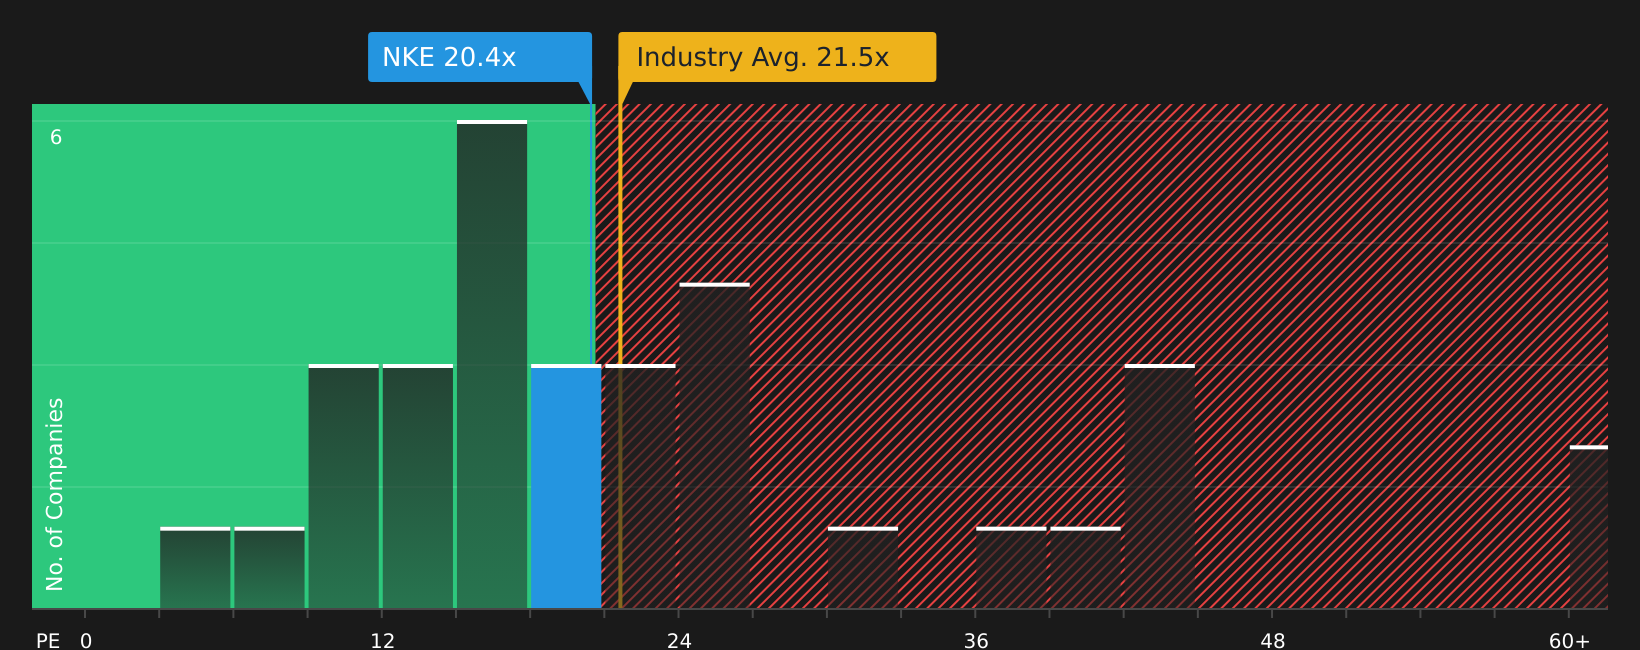
Approach 2: NIKE Price vs Earnings
For profitable companies, the P/E ratio is a useful way to gauge what you are paying for each dollar of earnings. It helps you compare how the market prices different businesses with similar profit profiles.
A “normal” or “fair” P/E ratio tends to reflect what investors are willing to pay given their expectations for earnings growth and their view of risk. Higher growth or lower perceived risk can justify a higher P/E, while slower growth or higher risk usually point to a lower P/E.
NIKE currently trades on a P/E of about 30.23x. That is slightly above the peer average of 29.43x and also above the Luxury industry average of 23.27x. Simply Wall St’s proprietary “Fair Ratio” for NIKE is 29.77x. This Fair Ratio is designed to capture what P/E might make sense for the stock by incorporating factors such as earnings growth, profit margins, risk characteristics, market cap and industry context. Because it uses these company specific inputs, it aims to be more tailored than a simple comparison with peers or a broad industry average.
Comparing NIKE’s actual P/E of 30.23x with the Fair Ratio of 29.77x suggests the current valuation is slightly richer, but broadly in line with that model.
Result: ABOUT RIGHT
P/E ratios tell one story, but what if the real opportunity lies elsewhere? Start investing in legacies, not executives. Discover our 20 top founder-led companies.
Upgrade Your Decision Making: Choose your NIKE Narrative
Earlier it was mentioned that there is an even better way to think about valuation. This is where Narratives come in as your way of attaching a clear story about NIKE to the numbers behind your own fair value, revenue, earnings and margin expectations, then linking that story to a forecast and finally to a fair value that you can compare with today’s share price to decide whether the stock looks expensive or attractive for you.
On Simply Wall St’s Community page, Narratives are an easy tool you can use to set out that story in a few assumptions, and they update automatically when fresh information such as news or earnings arrives, so your view stays current without you needing to rebuild a model every time.
For NIKE, one investor might build a more optimistic Narrative similar to the higher analyst fair values in the Community that assume revenue growth closer to 6.6%, profit margins around 11.1% and a future P/E near 33.9x. Another might sit at the other end of the range with a more cautious Narrative that uses revenue growth around a 0.6% decline, profit margins near 5.6% and a future P/E closer to 19.3x. This shows how two reasonable stories can lead to very different fair values off the same stock price.
For NIKE, however, we will make it really easy for you with previews of two leading NIKE Narratives:
These sit at opposite ends of the Community fair value range and show how different assumptions on growth, profitability and valuation can shape your view of the same stock price.
Fair value: US$96.60
Gap to this fair value from the current US$45.93 share price: about 52.5% below the narrative fair value on this view.
Revenue growth assumption: 2%
- Views NIKE as a core global brand that has gone through a rough patch but could recover with improved leadership decisions.
- Uses what the author describes as conservative growth and margin assumptions, supported by metrics such as 39.5% ROE, an 11.10% net income ratio and 19.63% ROIC.
- Sees the current valuation and dividend yield as attractive relative to a DCF value of US$82.02 and a P/E below the 10 year average, with potential for a higher share price over time if execution improves.
Fair value: US$43.01
Gap to this fair value from the current US$45.93 share price: about 6.8% above the narrative fair value on this view.
Revenue growth assumption: 10%
- Focuses on NIKE's position as a large, established player with a US$101.5b market cap, strong brand recognition and economies of scale that support cost efficiency.
- Highlights broad consumer reach and a balance sheet that supports ongoing product development and a direct to consumer push, which together may support long term demand across income levels.
- Even with those positives, concludes that the shares can look expensive relative to several valuation cross checks, so patience on entry price and close tracking of revenue growth, margins and capital allocation are important for valuation discipline.
Across the Community, 6 Narratives currently sit in the undervalued camp and 2 in the overvalued camp, which gives you a spread of fair values and storylines to stress test against your own expectations for NIKE.
Do you think there's more to the story for NIKE? Head over to our Community to see what others are saying!

This article by Simply Wall St is general in nature. We provide commentary based on historical data and analyst forecasts only using an unbiased methodology and our articles are not intended to be financial advice. It does not constitute a recommendation to buy or sell any stock, and does not take account of your objectives, or your financial situation. We aim to bring you long-term focused analysis driven by fundamental data. Note that our analysis may not factor in the latest price-sensitive company announcements or qualitative material. Simply Wall St has no position in any stocks mentioned.