

Corning (GLW) After Apple Glass Shift Raises Fresh Questions Over Valuation
Corning Inc GLW | 0.00 |
Corning stock moves after Apple product shift
Corning (GLW) shares fell 2.7% after reports that key customer Apple scrapped a planned all glass 20th anniversary iPhone model, raising fresh questions about future specialty glass demand.
For context, Corning’s recent 1 month share price return of 7.36% and year to date share price return of 83.07% point to strong momentum. However, the 3 month share price return declined 7.03%, and the 1 year total shareholder return of 156.42% and 3 year total shareholder return that is more than 4x suggest the longer term trend has been very strong.
If this kind of single stock move has your attention, it can be a useful time to look across the sector for other ideas and check out 55 AI infrastructure stocks
Corning now trades below both analyst targets and one estimate of intrinsic value after the Apple setback. Given that kind of gap, how much of the specialty glass risk is already reflected in the price?
Price-to-Earnings of 75.3x for Corning: Is it justified?
On simple valuation checks Corning screens as mixed. The stock trades at $165.99 and sits about 17.3% below one estimate of intrinsic value, yet carries a P/E of 75.3x.
The P/E ratio compares the current share price to earnings per share. For a company like Corning, which operates across optical communications, display glass and specialty materials, this ratio reflects what investors are willing to pay today for each dollar of current earnings.
Corning is described as expensive on a P/E basis relative both to the estimated fair P/E of 53.4x and to the broader US Electronic industry average of 31.5x. At the same time, it is labeled good value versus a peer group average P/E of 83.5x and is trading below an internal future cash flow estimate of $200.65. Those contrasts suggest the market is assigning a rich earnings multiple that still sits below some close peers, while also leaving a gap to one DCF style valuation level that investors may watch closely.
Against the sector backdrop, the P/E of 75.3x is more than double the US Electronic industry average of 31.5x. Compared to an estimated fair P/E of 53.4x, the current multiple stands well above the level the market could move towards if pricing aligned with that fair ratio signal over time.
Result: Price-to-Earnings of 75.3x (OVERVALUED)
However, Corning still faces key risks, including potential order shifts from large customers like Apple, as well as any slowdown in telecom or display equipment spending.
Another view on Corning's value
The P/E discussion presents Corning as expensive on earnings, yet the SWS DCF model points in the opposite direction. On that view, the stock at $165.99 sits below an estimated future cash flow value of $200.65, which suggests the market price is not fully reflecting those projected cash flows.
That split can signal either valuation risk if the growth implied by the DCF does not materialise, or opportunity if the cash flow profile holds up despite customer headlines. For investors comparing these signals, the question is which yardstick feels more grounded: current earnings, or the long term cash flow path.
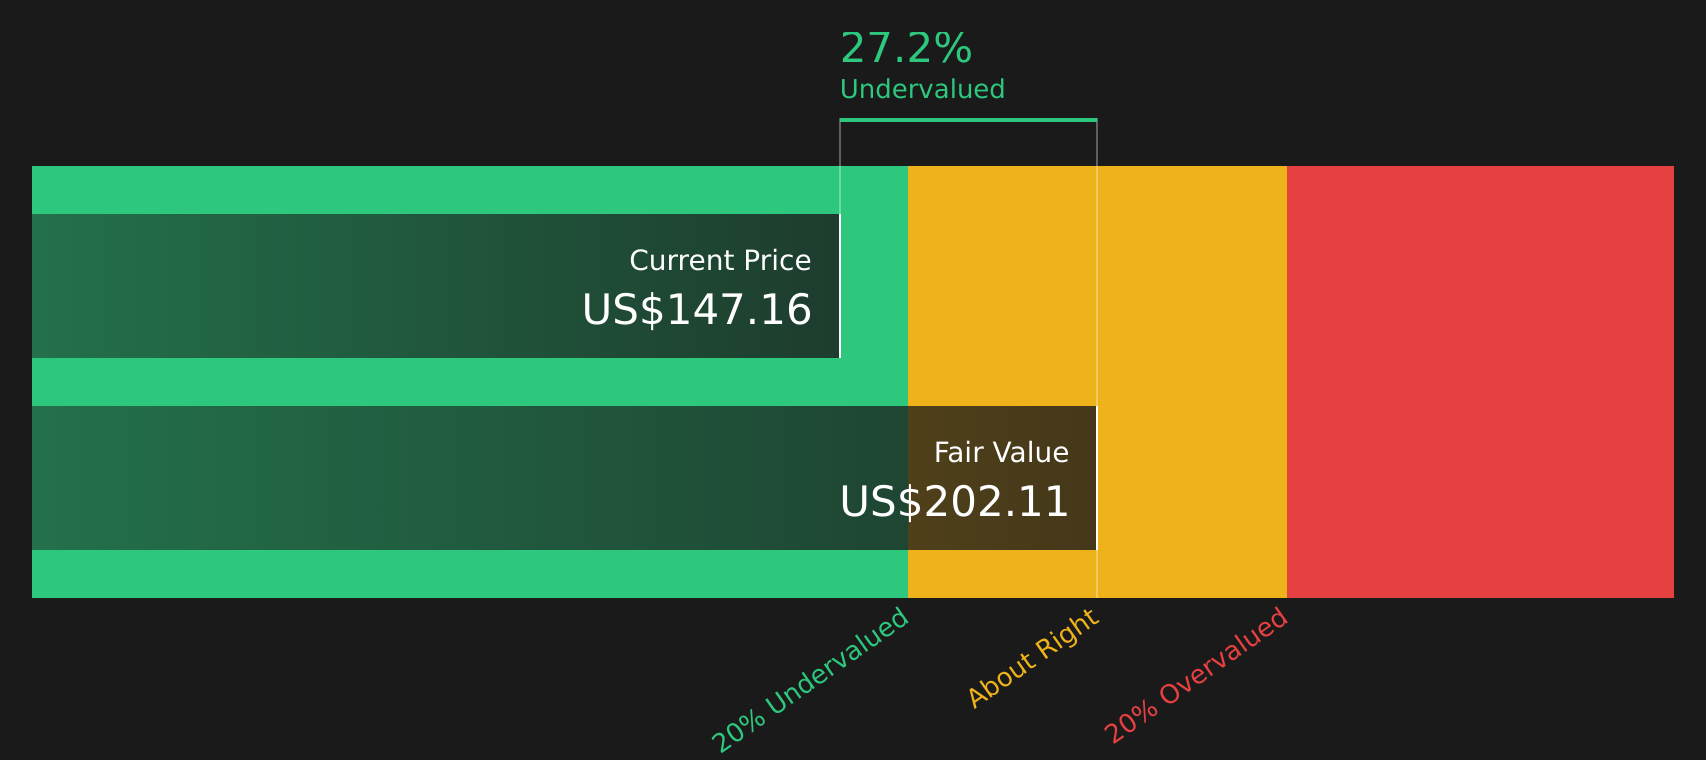
Simply Wall St performs a discounted cash flow (DCF) on every stock in the world every day (check out Corning for example). We show the entire calculation in full. You can track the result in your watchlist or portfolio and be alerted when this changes, or use our stock screener to discover 52 high quality undervalued stocks. If you save a screener we even alert you when new companies match - so you never miss a potential opportunity.
Next Steps
With Corning showing both risks and potential rewards, it makes sense to move quickly and review the numbers yourself. To see the fuller picture of concerns and optimism around this stock, take a look at the 3 key rewards and 3 important warning signs.
Looking for more investment ideas beyond Corning?
If Corning has you thinking harder about where to put fresh capital, broaden your watchlist now so you are not relying on a single story.
- Target dependable cash flow by reviewing companies that show up in our 10 dividend fortresses.
- Hunt for opportunities with upside potential using the screener containing 20 high quality undiscovered gems.
- Prioritise resilience and capital preservation by scanning stocks in the 80 resilient stocks with low risk scores.
This article by Simply Wall St is general in nature. We provide commentary based on historical data and analyst forecasts only using an unbiased methodology and our articles are not intended to be financial advice. It does not constitute a recommendation to buy or sell any stock, and does not take account of your objectives, or your financial situation. We aim to bring you long-term focused analysis driven by fundamental data. Note that our analysis may not factor in the latest price-sensitive company announcements or qualitative material. Simply Wall St has no position in any stocks mentioned.