Event Reminder | Get Ready for 3:30 PM Today (Wednesday, June 10th)
S&P 500 index SPX | 0.00 | |
NASDAQ IXIC | 0.00 | |
Dow Jones Industrial Average DJI | 0.00 | |
NASDAQ-100 NDX | 0.00 | |
S&P 500 index GSPC | 0.00 |
Event's Background
The US Bureau of Labor Statistics is set to publish the May Consumer Price Index on Wednesday, June 10 (15:30 Riyadh Time / 8:30 a.m. ET), and this release arrives at a much more dangerous macro juncture than a typical monthly inflation print.
| Time (Riyadh) | Indicator | Previous | Consensus | Forecast |
|---|---|---|---|---|
| 03:30 PM | Core Inflation Rate MoM MAY | 0.4% | 0.3% | 0.3% |
| 03:30 PM | Core Inflation Rate YoY MAY | 2.8% | 2.9% | 2.9% |
| 03:30 PM | Inflation Rate MoM MAY | 0.6% | 0.5% | 0.4% |
| 03:30 PM | Inflation Rate YoY MAY | 3.8% | 4.2% | 4.0% |
| 03:30 PM | CPI MAY | 333.02 | 335.11 | 334.3 |
| 03:30 PM | CPI s.a MAY | 332.407 | 333.7 |
Two weeks ago, markets were still debating how many cuts the “Warsh Fed” might eventually deliver later this year; after last Friday’s payrolls shock, that debate has been largely replaced by a debate about whether the FOMC will need to tighten further.
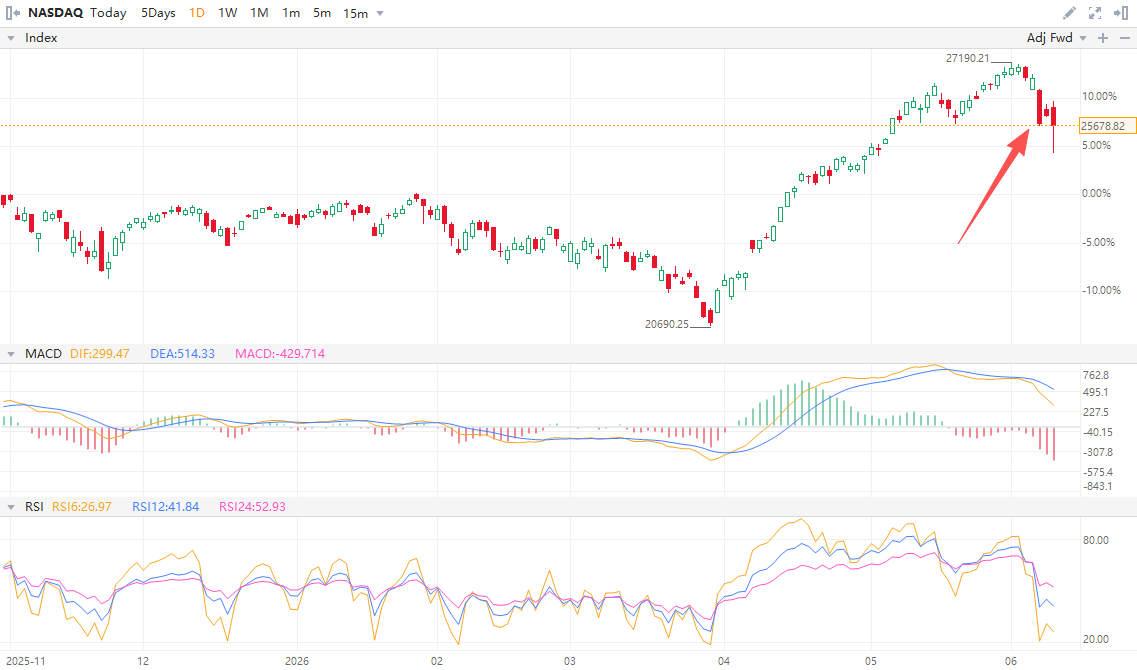
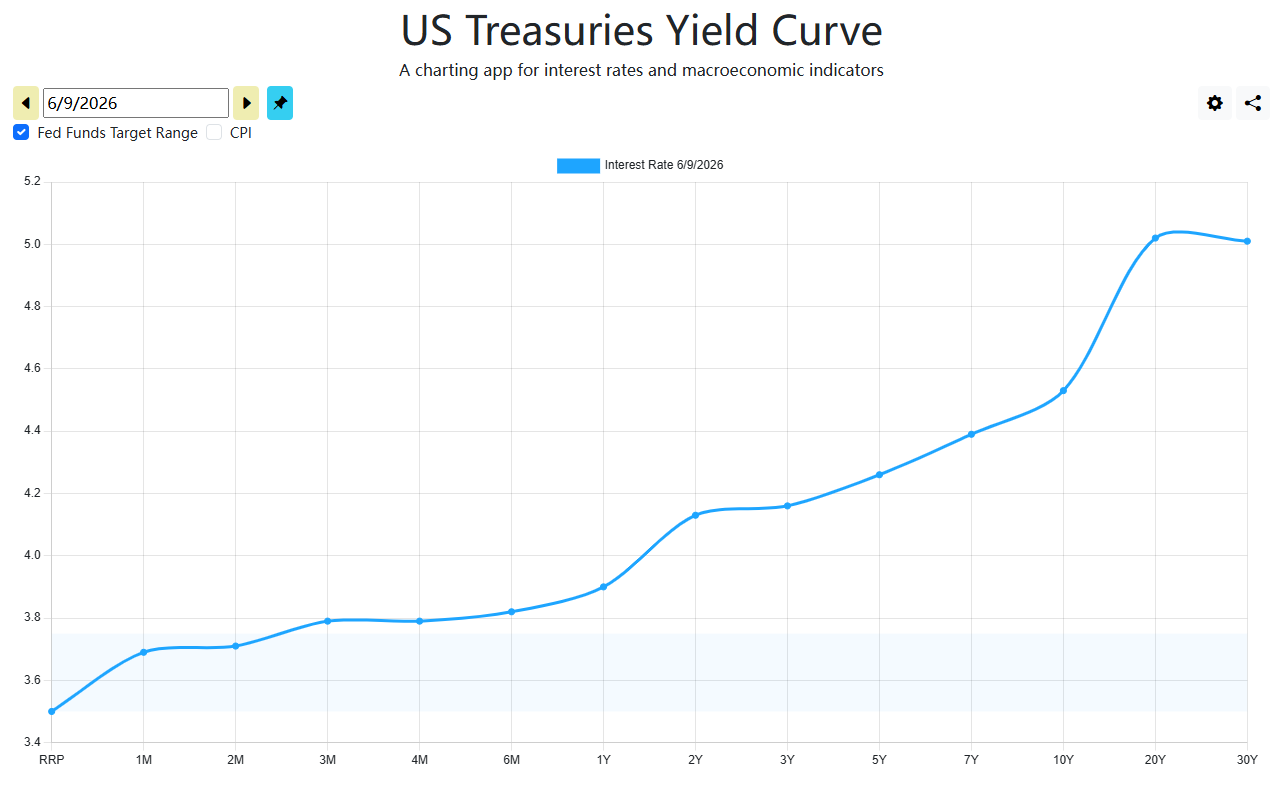
May’s employment report printed a net +172,000 jobs—nearly double the roughly +85,000 consensus—while the unemployment rate held 4.3%. The reaction was violent: the 10-year Treasury yield jumped toward 4.55%, the 2-year hit 4.18% (its highest since early 2025), and the Nasdaq suffered one of its worst single-day point drops on record, down more than 1,121 points (-4.2%).
In other words, the market’s “cut hallucination” didn’t just fade—it was effectively swallowed by the data.
Against that backdrop, Wednesday’s CPI isn’t just another update; it is the catalyst that could lock in a hawkish regime shift before Chair Kevin Warsh’s first meeting on June 17!!!
What’s Expected?
The consensus now centers on a headline CPI print that breaks above 4% y/y, a psychological and technical threshold for risk assets and Fed rhetoric alike.
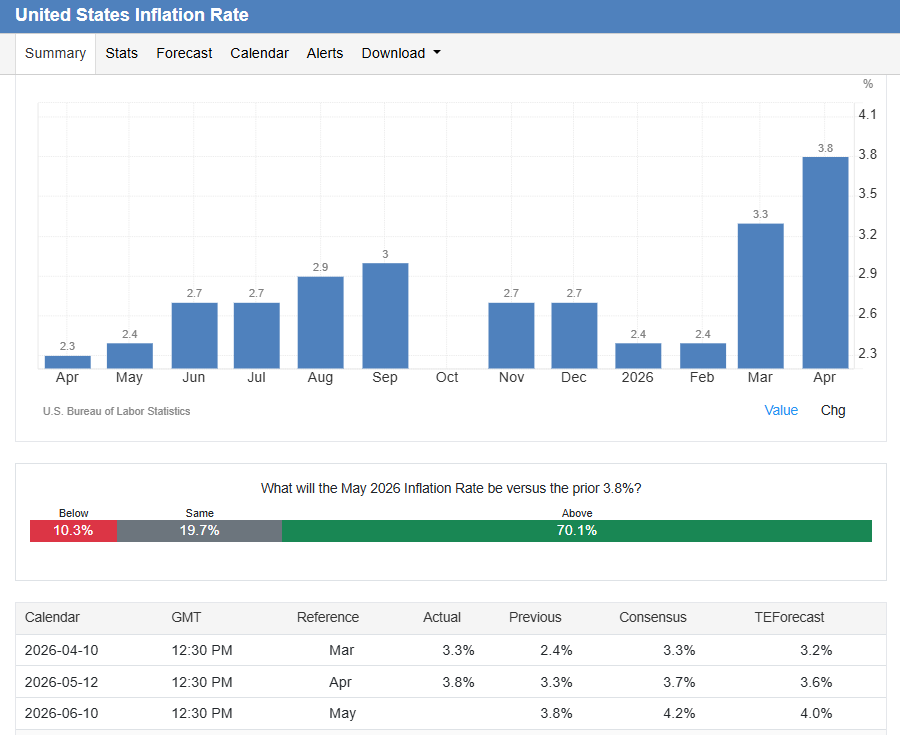
Most surveys point to +0.5% m/m and roughly 4.2% y/y (April was 3.8% y/y, April m/m +0.6%), with some banks/dealers flagging upside risk toward 4.3% depending on how energy items settle inside the collection window.
The Cleveland Fed’s Inflation Nowcasting lines up with the mainstream: about +0.46% m/m and 4.2% y/y for headline, and a cooler ~+0.23% m/m for core (around 2.8–2.9% y/y).
In plain terms: the headline spike is the headline, but the core is the truth test.
Markets should interpret the release as a two-tier signal.
- If headline jumps above 4% but core arrives near +0.2% m/m (or at least clearly below +0.35%), the story stays “energy shock + still-slow shelter disinflation,” and the Fed can frame the outlook as “watchful, not automatic.”
- If core instead prints ≥+0.35% m/m, the narrative becomes: the oil shock is leaking into broader baskets—travel services, logistics, food/freight—and the Fed’s comfort zone collapses.
Impact on sentiment
For equities, the reaction function is asymmetrical, and the base case is fragile.
Morgan Stanley’s (via JPM scenario framing cited in your sources) mapping is blunt: outcomes where core CPI prints hotter than ~+0.30–0.35% m/m skew toward SPX declines of 0.75% to as much as 2–3%, while a “contained core” near +0.20–0.25% opens room for a +0.75% to +1.25% bounce as rate-hike pricing eases.
The same sources add a longer-run stat worth respecting: once CPI y/y crosses 4%, the S&P 500 has historically averaged a ~4% pullback over 3 months and ~7% over 6 months, which is why traders are treating this release as a regime-check, not routine noise.
Mechanically, a hotter-than-feared print would validate the move already underway: longer yields grinding higher, the 2-year staying firm, and tech/growth bearing the brunt via multiple compression.
A cleaner print—especially if core comes in <+0.20% m/m—doesn’t magically restore the old “two cuts this year” world (that door is basically closed), but it can stop the liquidation and let stocks breathe by pulling the “extra hike” tail-risk back off the table.