

Gold on $4,314 Cliff: Morgan Stanley Says $5,200 — But Can Bulls Hold the Line?
SPDR Gold GLD | 0.00 | |
Gold Trust Ishares IAU | 0.00 | |
VanEck Vectors Gold Miners ETF GDX | 0.00 | |
Newmont Corporation NEM | 0.00 | |
Agnico Eagle Mines Limited AEM | 0.00 |
Gold is entering a critical phase after its recent pullback. Spot gold is trading around $4,342/oz, with the market caught between renewed safe-haven demand and sharply higher U.S. Treasury yields.
The near-term outlook remains cautiously bullish but highly yield-sensitive, according to the latest market analysis. The key question is whether falling yields and renewed investment demand can offset the pressure from elevated real rates.
Why Gold Pulled Back
The latest selloff was driven primarily by the bond market.
The U.S. 30-year Treasury yield recently climbed to around 5.24%, its highest level since 2007, while the 10-year yield reached approximately 4.71%. Higher yields increase the opportunity cost of holding gold, while also supporting the U.S. dollar.
At the same time, geopolitical tensions have provided support for gold's safe-haven appeal. However, the rise in oil prices creates a complication: higher energy prices can reinforce inflation expectations, potentially reducing the Federal Reserve's room to ease policy.
This explains the current two-way trading pattern: geopolitical risk supports gold, while higher yields cap its upside.
Three Factors to Watch Next
1. U.S. Treasury Yields
This remains the most important near-term driver.
If long-term yields stabilize or decline, the pressure on gold should ease. Conversely, another sustained rise in yields would increase downside risks.
The latest technical analysis therefore maintains a cautiously bullish bias, but explicitly warns that gold remains highly sensitive to yields.
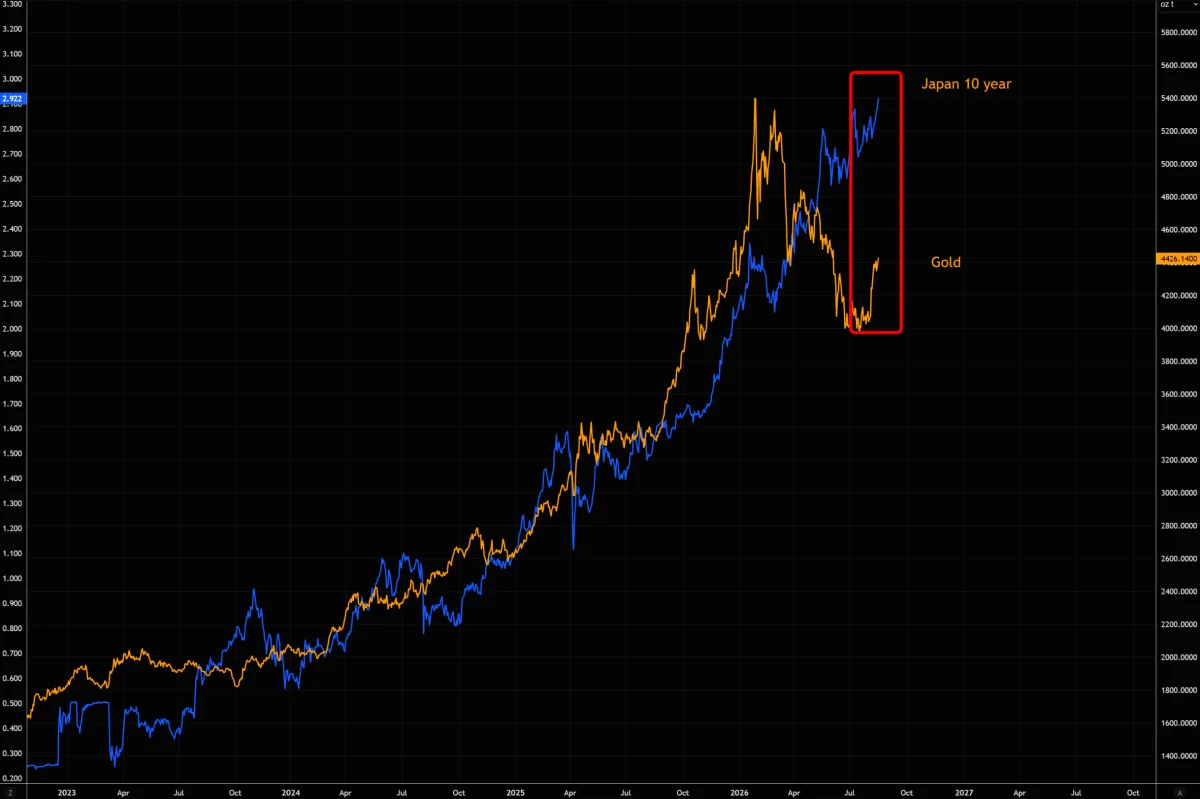
Japanese government bond yields are also back on the radar: gold has recently begun tracking Japan’s long-end rates again, suggesting that shifts in global bond markets—not just U.S. Treasury yields—are becoming increasingly important to gold’s price action.
2. Fed Minutes and Jackson Hole
The August 19 FOMC minutes are the immediate catalyst, followed by the Jackson Hole symposium.
Markets will be looking for clues about whether policymakers are becoming more concerned about slowing growth or remain focused on inflation.
A dovish interpretation would likely be supportive for gold through lower yields and a weaker dollar, while a hawkish message could extend the current consolidation.
3. Gold ETF Flows
Investment demand is the key confirmation that gold's longer-term bull market is broadening.
Morgan Stanley commodity strategists Amy Gower and Martijn Rats maintain a $5,200/oz second-half target, but warn that the target will be difficult to achieve without a meaningful recovery in gold ETF inflows. They specifically identify the Fed's policy path, real yields and the U.S. dollar as key determinants of ETF demand.
The World Gold Council's latest data also show that global gold ETFs remained net positive year-to-date through June, with H1 inflows of about $8 billion, although June alone saw approximately $8.9 billion of outflows.
Therefore, a renewed acceleration in ETF inflows would provide stronger confirmation for the bullish case.
Technical Outlook: $4,314 vs. $4,452
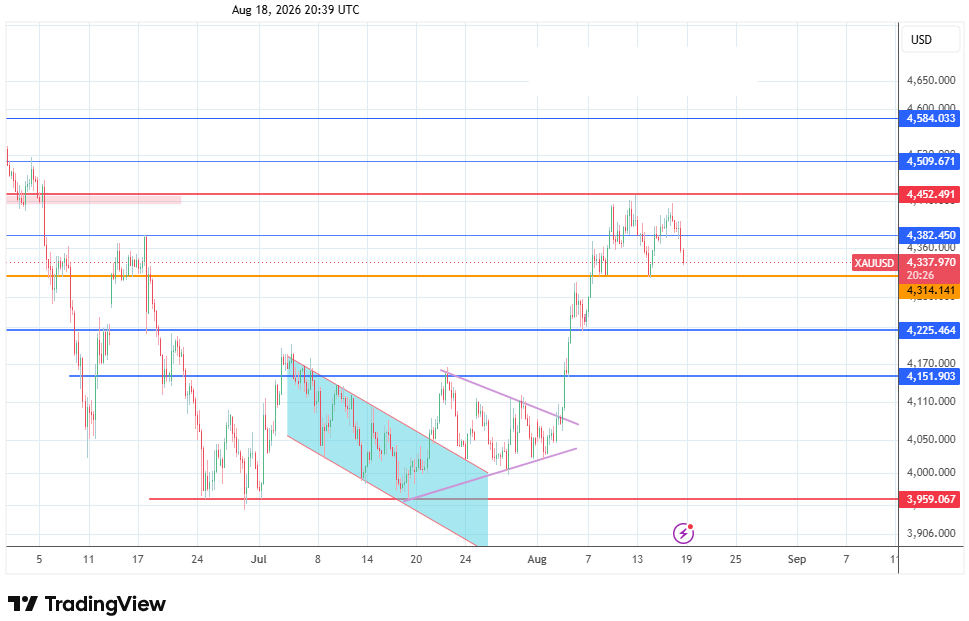
The current four-hour chart presents a clear technical range.
According to the latest technical analysis:
$4,314: key neckline support. A sustained break below it would strengthen the bearish double-top setup and expose $4,213.
$4,452: first major resistance and the key upside trigger.
$4,509: next upside target if $4,452 is decisively broken.
$4,584: stronger resistance zone based on previous highs.
The technical bias therefore remains bullish above $4,314, while a break below that level would materially weaken the structure.
A move through $4,452, meanwhile, would provide a stronger signal that the correction has ended and the broader uptrend is resuming.
Strategy: Wait for Macro Confirmation
The current setup favors confirmation rather than chasing geopolitical rallies.
- The bullish scenario would be:
Gold holds $4,314 + Treasury yields stabilize/fall + ETF inflows recover → retest of $4,452 → $4,509/$4,584.
This scenario is consistent with Morgan Stanley's longer-term bullish view and its $5,200/oz target, although the bank stresses that ETF demand needs to return.
- The bearish scenario would be:
Yields rise further + Fed turns more hawkish + gold breaks $4,314 → $4,213 becomes the next downside target.
For now, the most important signal is therefore not the geopolitical headline itself, but whether Treasury yields begin to fall while gold holds technical support.
Gold-Related Instruments
For investors looking for listed exposure, several instruments can express different versions of the gold thesis:
| Ticker | Asset | Role |
|---|---|---|
| SPDR Gold(GLD.US) | Physical gold ETF | Direct gold exposure |
| Gold Trust Ishares(IAU.US) | Physical gold ETF | Lower-cost bullion exposure |
| Gold miners ETF | Higher-beta gold exposure | |
| Newmont Corporation(NEM.US) | Gold Miners | Major gold producer |
| Agnico Eagle Mines Limited(AEM.US) | Gold Miners | Large-cap gold miner |
| Gold Miners | Diversified precious-metals miner |
Other Related Assets:
The Gold Trust Ishares(IAU.US) is designed to track the price of gold bullion and uses the LBMA Gold Price as its benchmark, making it a straightforward vehicle for investors seeking bullion exposure.
For investors willing to accept greater equity and operational risk, VanEck Vectors Gold Miners ETF(GDX.US) provides exposure to a portfolio of major gold miners. VanEck notes that gold miners have historically offered higher-beta exposure to gold prices, while the fund currently holds major producers including Agnico Eagle, Newmont and Barrick Mining.
This distinction matters: bullion ETFs are primarily a gold-price trade, while miners are a gold-price-plus-equity-operating-leverage trade. If gold breaks decisively above $4,452 and heads toward $4,500+, miners could potentially outperform—but they will also carry greater equity-market and company-specific risks.
Bottom Line
Gold's long-term bullish thesis remains intact, but the short-term trade has become more balanced.
$4,314 is the key support; $4,452 is the key breakout level. Holding the former while Treasury yields retreat would strengthen the bullish case, while a break below it would expose $4,213.
Morgan Stanley's $5,200 target remains an important long-term bullish reference, but the bank itself says a meaningful recovery in ETF demand is necessary.
For now, the best signal to watch is simple: Can gold hold $4,314 while U.S. yields stop rising? If yes, the next test of $4,452 could determine whether the current pullback is merely a pause—or the beginning of a deeper correction.
Declaration: This article is for informational purposes only and does not constitute investment advice. Gold and gold-related securities can be highly volatile, and past performance does not guarantee future results.