Has Alibaba Group Holding (NYSE:BABA) Run Too Far After Its 50% One Year Rally?
Alibaba Group Holding Ltd. Sponsored ADR BABA | 133.19 | +1.40% |
- If you are wondering whether Alibaba Group Holding is still attractively priced after its recent run, you are not alone. Many investors are asking the same question right now.
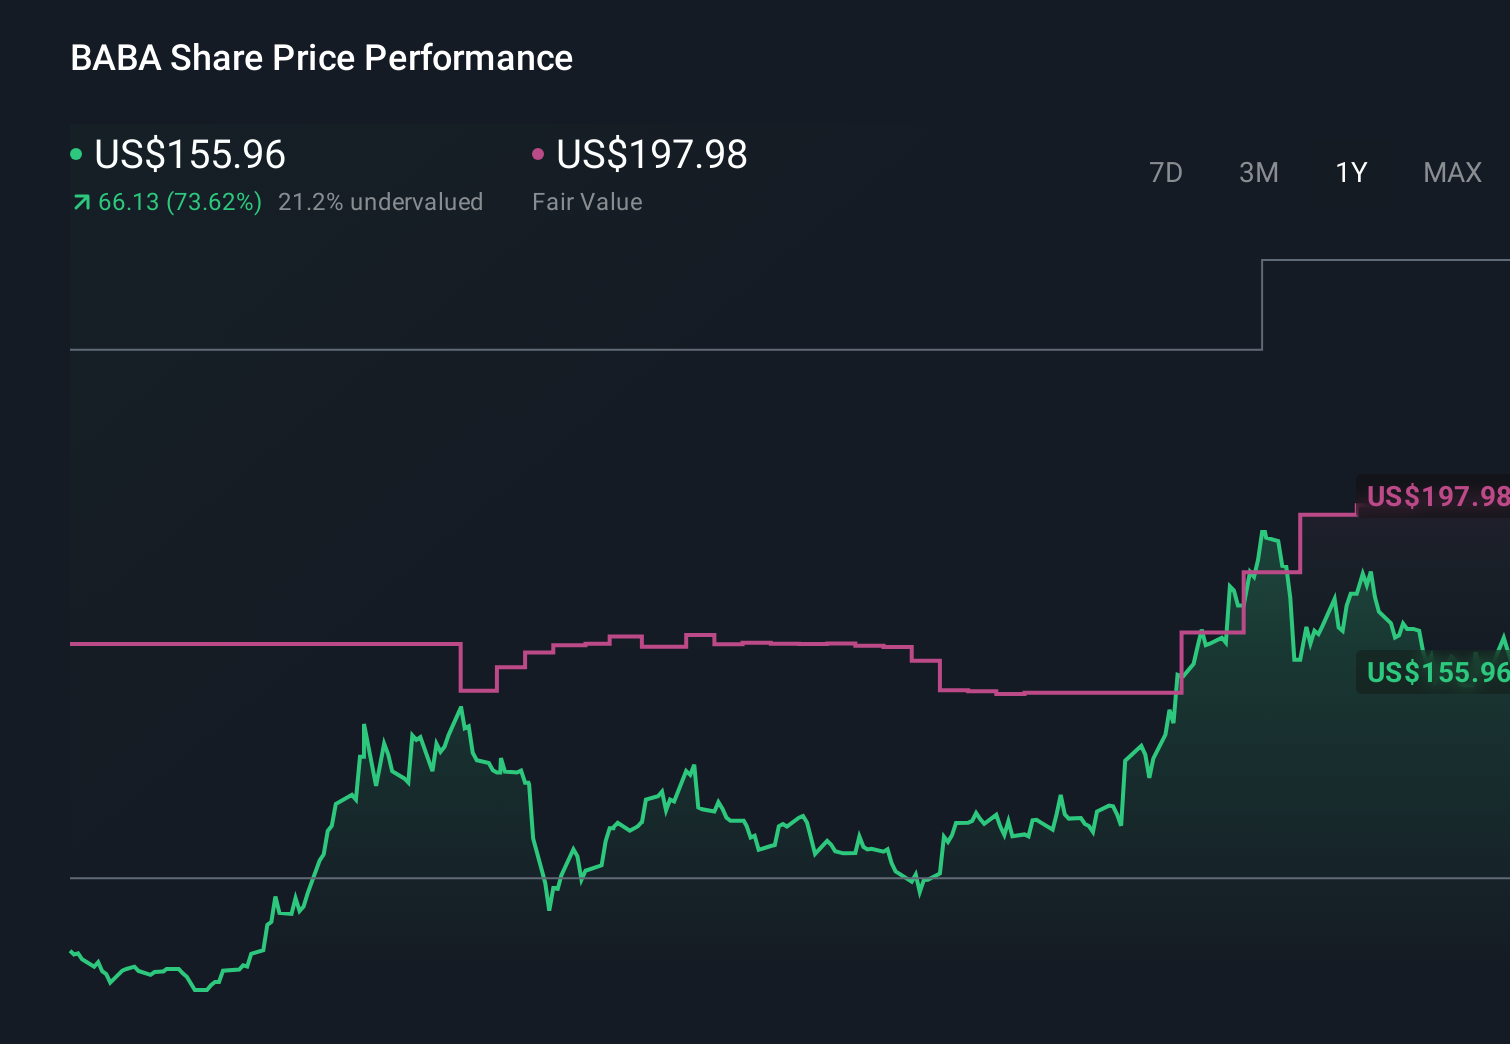
- At a last close of US$166.51, the stock has returned 1.7% over 7 days, 10.3% over 30 days, 6.9% year to date and 50.1% over 1 year, while the 5 year return sits at a 35.3% decline and the 3 year return is 68.1%.
- Recent headlines have focused on Alibaba's position as a major Chinese e commerce and cloud player, as well as ongoing attention on large Chinese technology platforms in global markets. These themes help frame how investors are thinking about its long term prospects and the risks that might be baked into the current share price.
- Our valuation checks suggest Alibaba scores 4 out of 6 on our value framework, giving it a value score of 4. In the sections ahead we will compare several valuation approaches before finishing with a more rounded way to think about what that number really means.
Approach 1: Alibaba Group Holding Discounted Cash Flow (DCF) Analysis
A Discounted Cash Flow, or DCF, model estimates what a company might be worth today by projecting its future cash flows and discounting them back to a present value.
For Alibaba Group Holding, the model used is a 2 Stage Free Cash Flow to Equity approach, based on cash flows reported in CN¥. The latest twelve month free cash flow is CN¥50.9b. Analyst and extrapolated projections used in the model show free cash flow estimates such as CN¥48.7b in 2026 and CN¥183.0b in 2029, with further years extended by Simply Wall St to build a 10 year path of cash flows.
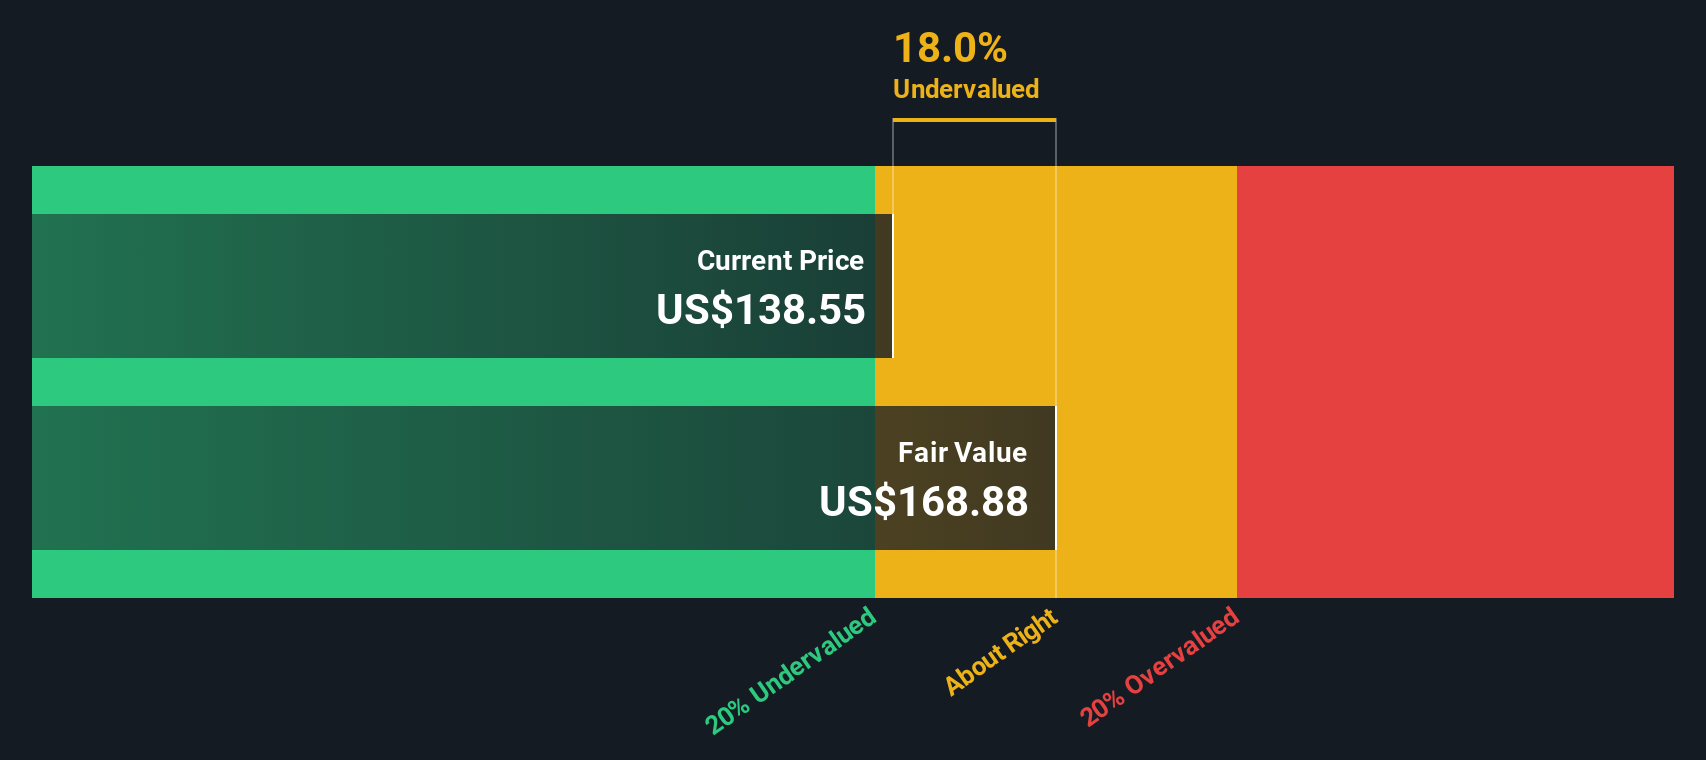
Pulling these projections together, the DCF model arrives at an estimated intrinsic value of US$266.07 per share, compared with the recent US$166.51 share price. That gap implies a 37.4% discount, suggesting the market price is materially below this cash flow based estimate.
Result: UNDERVALUED
Our Discounted Cash Flow (DCF) analysis suggests Alibaba Group Holding is undervalued by 37.4%. Track this in your watchlist or portfolio, or discover 51 more high quality undervalued stocks.
Approach 2: Alibaba Group Holding Price vs Earnings
For a profitable company like Alibaba Group Holding, the P/E ratio is a useful way to see how much you are paying for each dollar of current earnings. In general, higher expected growth and lower perceived risk tend to support a higher P/E, while lower growth and higher risk usually point to a lower, more cautious multiple.
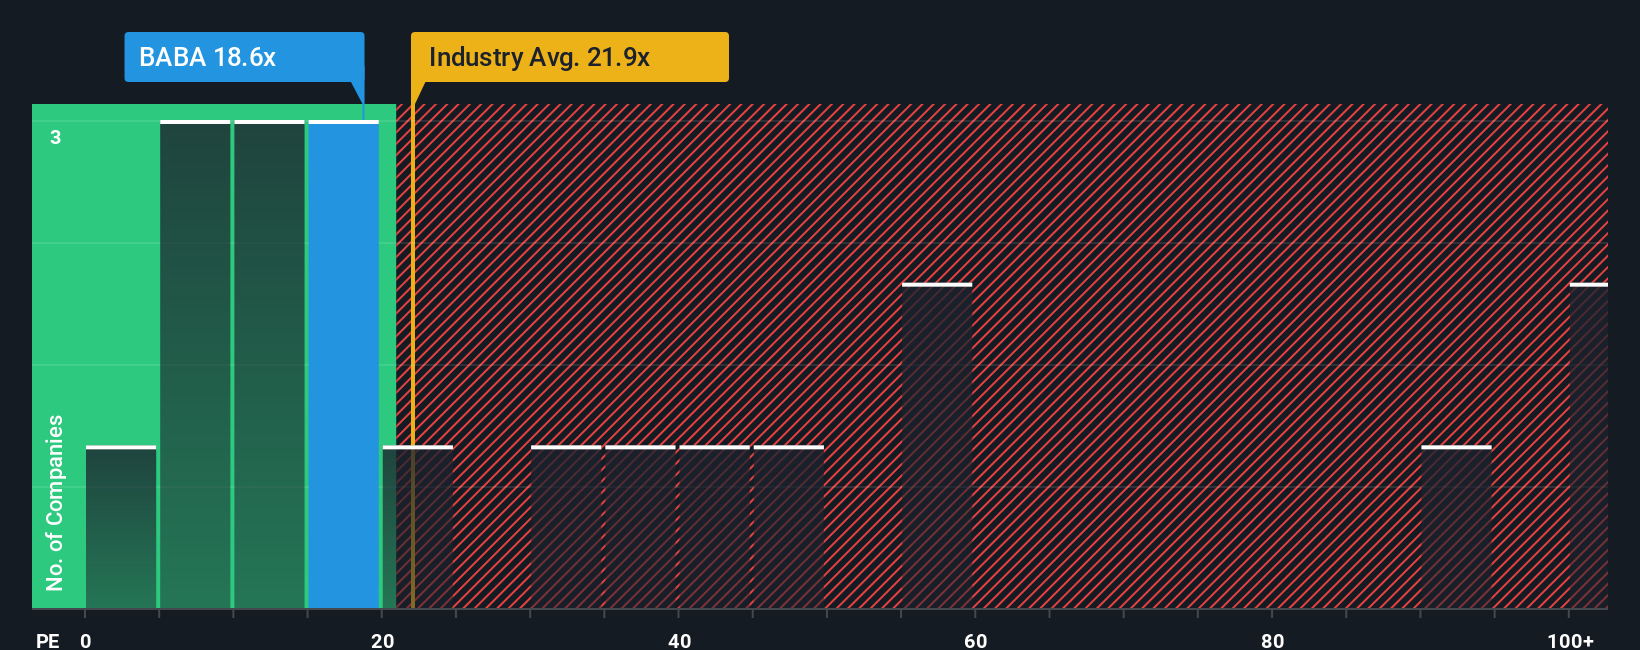
Alibaba currently trades on a P/E of 20.51x. That sits close to the Multiline Retail industry average P/E of 20.18x and below the peer group average of 33.86x, which indicates the market is valuing its earnings more in line with the broader industry than with higher rated peers.
Simply Wall St also calculates a Fair Ratio, which is its estimate of what Alibaba’s P/E might be given factors such as earnings growth, profit margins, industry, market cap and company specific risks. For Alibaba, that Fair Ratio is 30.37x. This kind of tailored yardstick can be more informative than a simple comparison with industry or peers because it adjusts for company characteristics rather than assuming one size fits all.
Comparing the Fair Ratio of 30.37x with the current P/E of 20.51x suggests the shares are trading below that calibrated level.
Result: UNDERVALUED
P/E ratios tell one story, but what if the real opportunity lies elsewhere? Start investing in legacies, not executives. Discover our 23 top founder-led companies.
Upgrade Your Decision Making: Choose your Alibaba Group Holding Narrative
Earlier we mentioned that there is an even better way to understand valuation, so let us introduce you to Narratives, which are simply your story about a company tied directly to your own assumptions for future revenue, earnings, margins and fair value.
On Simply Wall St’s Community page, Narratives let you spell out why you think Alibaba Group Holding looks the way it does, then link that story to a forecast and a fair value estimate you can compare with the current share price. This can help you consider whether it may be closer to a buy, hold or sell for your portfolio.
Narratives update automatically when fresh information arrives, such as earnings releases or news. Your fair value view moves with the story rather than sitting as a one off spreadsheet you forget to revisit.
For Alibaba, one investor might see a cautious story around trade and regulatory risks and arrive at a fair value near US$107 per share. Another might focus on AI, cloud and long term earnings power and land closer to US$785. Narratives makes those differing views easy to compare against today’s market price.
For Alibaba Group Holding however we will make it really easy for you with previews of two leading Alibaba Group Holding Narratives:
Fair value in this bull case: US$197.66 per share
Implied discount to this fair value: around 15.8% below the narrative estimate
Revenue growth assumption: 9.2% a year
- Focuses on heavy investment in AI, cloud and quick commerce that is expected to support higher long term revenue and earnings power despite near term pressure on profitability.
- Highlights integration across e commerce, local services and loyalty programs as a way to deepen user engagement and improve monetization over time.
- Draws on analyst forecasts that build to higher earnings by around 2028, using a discount rate of about 9.3% and a higher future P/E than today to arrive at the fair value estimate.
Fair value in this bear case: US$107.09 per share
Implied premium to this fair value: around 55.4% above the narrative estimate
Revenue growth assumption: 14.1% a year
- Uses a DCF framework that starts from about US$15b in free cash flow, assumes revenue growth that tapers from 8% to a 2.5% terminal rate and applies a cost of equity of 9.4%.
- Flags risks around US China trade tensions, regulation, competition in cloud and AI, and currency exposure as reasons to be cautious about paying above the narrative fair value.
- Points out that while Alibaba has strong positions in e commerce and AI cloud, this view sees the current share price as already reflecting those positives given the macro and policy overhangs.
Together, these two narratives show how different assumptions on growth, profitability and risk can lead to very different fair value anchors for the same US$166.51 share price. If you want to go further, you can compare all six Alibaba Narratives on Simply Wall St or build your own to match your expectations for earnings, valuation and risk.
Do you think there's more to the story for Alibaba Group Holding? Head over to our Community to see what others are saying!
This article by Simply Wall St is general in nature. We provide commentary based on historical data and analyst forecasts only using an unbiased methodology and our articles are not intended to be financial advice. It does not constitute a recommendation to buy or sell any stock, and does not take account of your objectives, or your financial situation. We aim to bring you long-term focused analysis driven by fundamental data. Note that our analysis may not factor in the latest price-sensitive company announcements or qualitative material. Simply Wall St has no position in any stocks mentioned.