Has General Electric (GE) Run Too Far After Its 51% One Year Rally
GE Aerospace GE | 314.60 | -1.07% |
- If you are wondering whether General Electric's share price still makes sense after a strong run, this article is here to help you unpack what that price might be implying about value today.
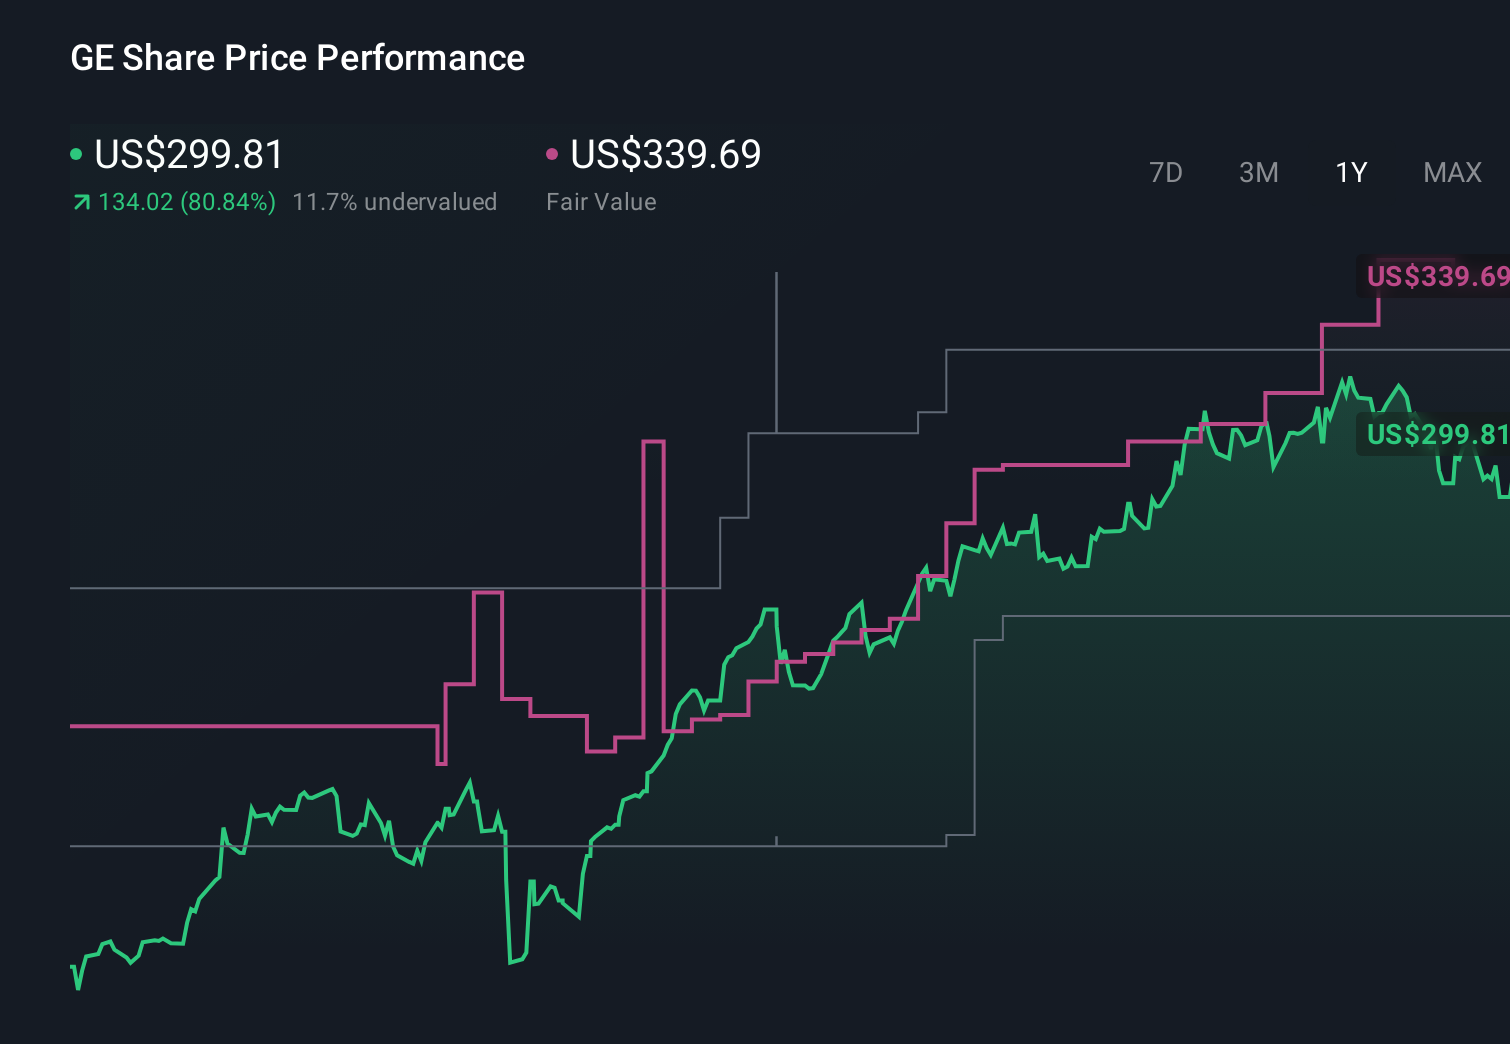
- GE closed at US$315.41, with returns of 51.0% over 1 year and a very large gain over 3 years, while the last 7 days, 30 days and year to date show modest pullbacks of 0.3%, 3.0% and 1.7% respectively.
- Recent news around General Electric has mainly focused on its ongoing position in the capital goods space and the market's interest in its focused business model following previous corporate simplifications. This backdrop helps explain why the stock has seen strong multi year returns even as shorter term moves have cooled.
- Simply Wall St currently gives GE a valuation score of 3 out of 6, which suggests some checks point to the shares looking undervalued while others do not. In the sections ahead we will look at the different valuation approaches behind that score, before finishing with a more holistic way to think about what GE might be worth.
Approach 1: General Electric Discounted Cash Flow (DCF) Analysis
A Discounted Cash Flow, or DCF, model takes estimates of the cash a company could generate in the future and discounts those amounts back to what they might be worth in today’s dollars. It is a way of asking what you might reasonably pay now for those future cash flows.
For General Electric, Simply Wall St uses a 2 Stage Free Cash Flow to Equity model. The latest twelve month free cash flow is about US$7.33b. Analysts provide explicit forecasts out to 2029, with projected free cash flow of US$10.98b by the end of that year. The figures from 2030 to 2035, which reach around US$15.08b, are extrapolated by Simply Wall St based on earlier analyst inputs.
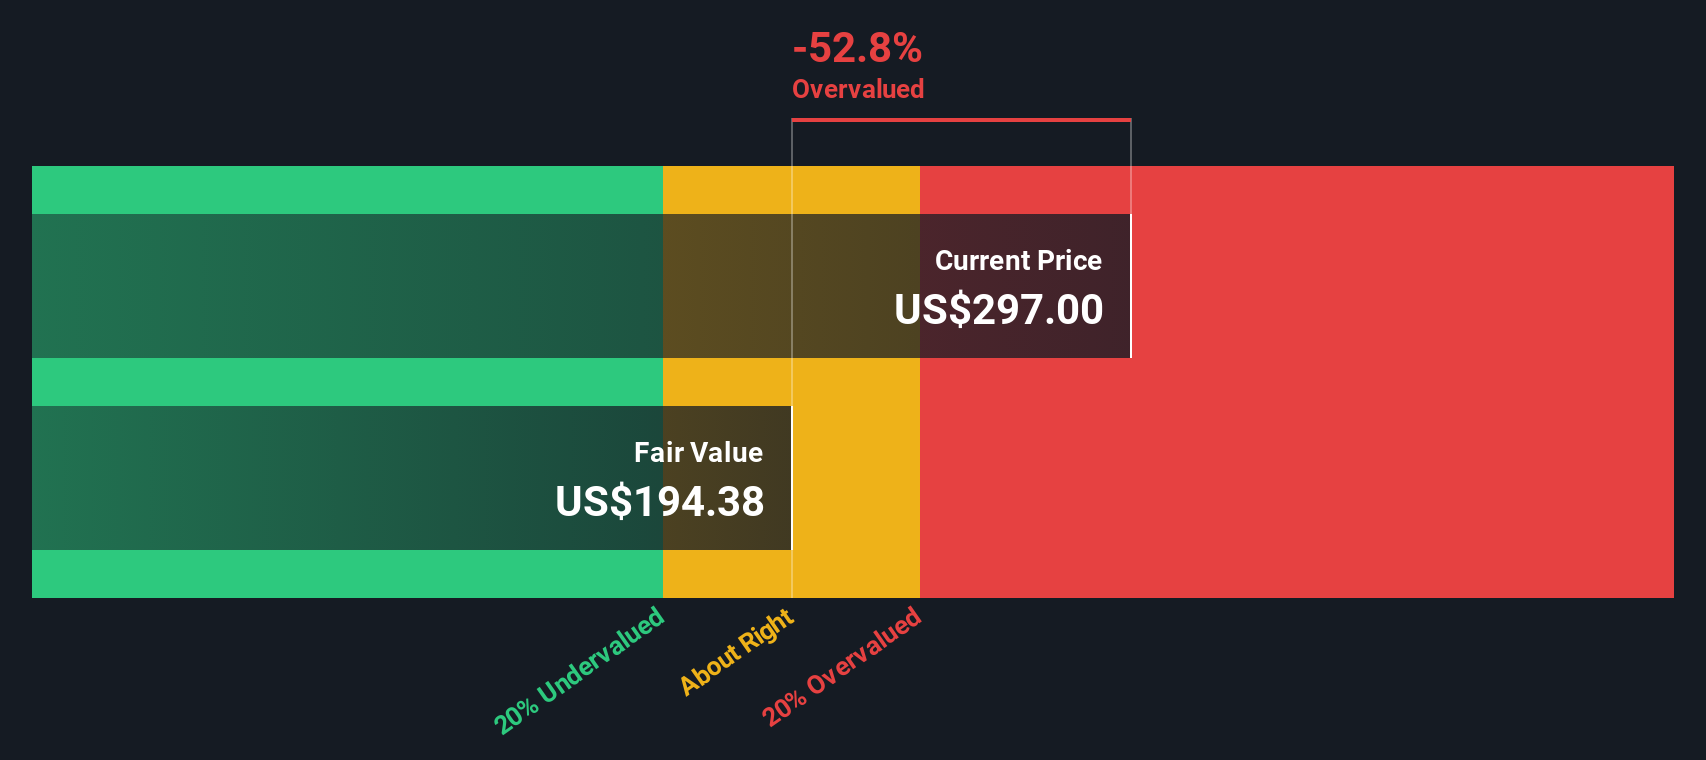
After discounting this stream of projected cash flows back to today, the model arrives at an estimated intrinsic value of US$246.92 per share. Compared with the recent share price of US$315.41, the DCF output suggests General Electric trades at roughly a 27.7% premium to this estimate. On this specific model, the shares appear overvalued relative to the calculated intrinsic value.
Result: OVERVALUED
Our Discounted Cash Flow (DCF) analysis suggests General Electric may be overvalued by 27.7%. Discover 55 high quality undervalued stocks or create your own screener to find better value opportunities.
Approach 2: General Electric Price vs Earnings
For a profitable company like General Electric, the P/E ratio is a useful shorthand for what the market is paying for each dollar of earnings. It reflects not only current profitability, but also what investors collectively expect in terms of future growth and how much risk they are willing to accept for those earnings.
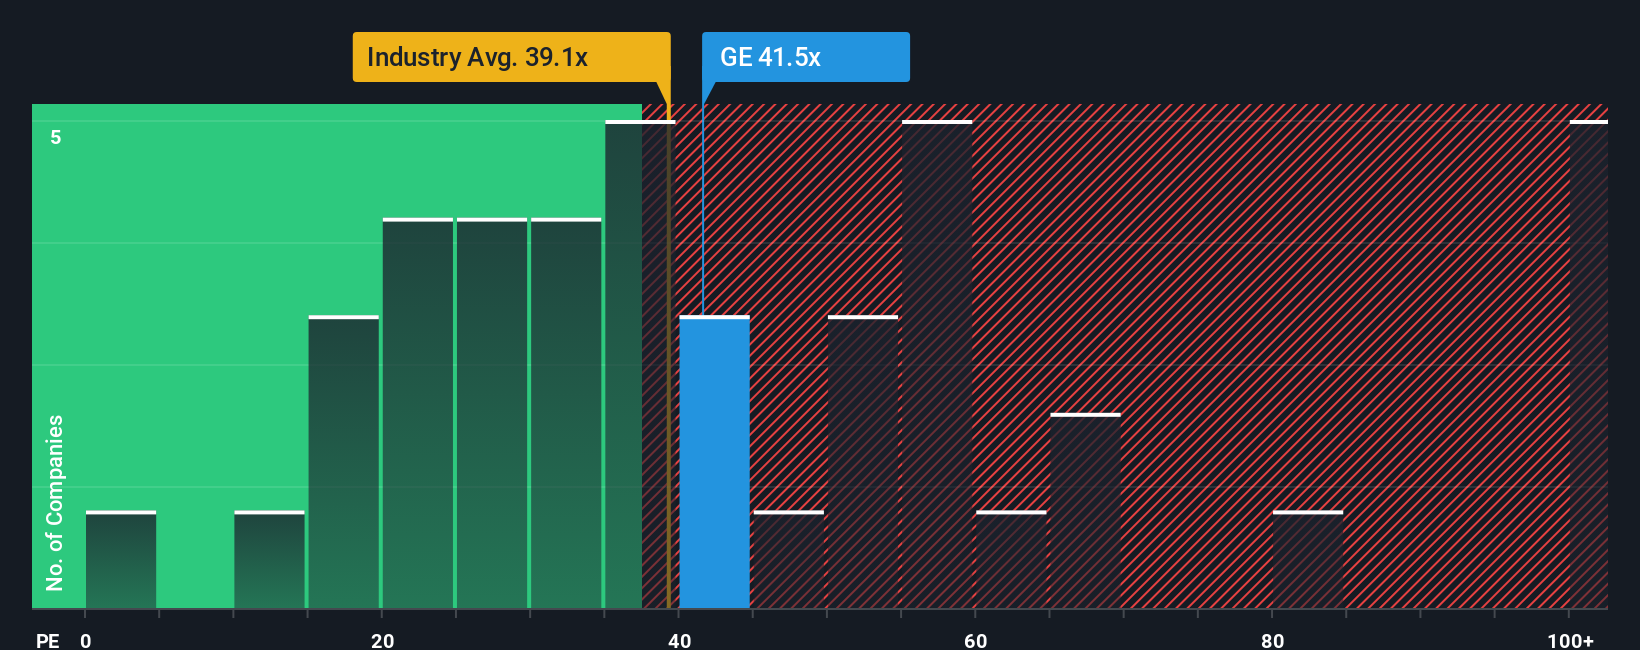
Higher growth expectations or lower perceived risk usually support a higher, or “richer,” P/E ratio, while slower expected growth or higher risk typically align with a lower P/E. General Electric currently trades on about 38.46x earnings. That sits below the Aerospace & Defense industry average of roughly 40.65x and the peer group average of about 48.67x.
Simply Wall St’s Fair Ratio for General Electric is 39.87x. This is a proprietary estimate of what a more tailored P/E might look like after considering factors such as earnings growth, profit margins, industry, market cap and company specific risks. Because it is built around the company’s own profile, the Fair Ratio can be more informative than a simple comparison with peers or the broad industry, which may have very different characteristics.
With the current P/E of 38.46x sitting slightly below the Fair Ratio of 39.87x, General Electric appears modestly undervalued on this measure.
Result: UNDERVALUED
P/E ratios tell one story, but what if the real opportunity lies elsewhere? Start investing in legacies, not executives. Discover our 23 top founder-led companies.
Upgrade Your Decision Making: Choose your General Electric Narrative
Earlier we mentioned that there is an even better way to understand valuation, so let us introduce Narratives. These are Simply Wall St tools on the Community page that let you write your view of General Electric’s future revenue, earnings and margins, link that story to a forecast, turn it into a fair value, and then compare that fair value with the current share price. All of this updates as new news or earnings arrive. A cautious GE narrative might look closer to the lower fair value around US$301, while an optimistic view might sit nearer the higher fair value of about US$394, showing how two investors can look at the same company and reach very different, but clearly explained, conclusions about whether the shares look expensive or attractive to them.
For General Electric however we'll make it really easy for you with previews of two leading General Electric Narratives:
These give you a structured way to decide whether the current US$315.41 share price feels closer to an opportunity or to a stretch, based on clear assumptions about growth, margins and valuation multiples.
Fair value in this bullish narrative: US$357.24 per share
Implied discount to this fair value at the last close: about 11.7% undervalued
Revenue growth used in this narrative: 7.68% a year
- Focuses on aerospace order wins, next generation engine programs and digital tools that support higher long term revenue and margin outcomes, with services playing a key role.
- Assumes earnings rise to US$9.5b by about 2028, with profit margins edging up and the P/E at 38.9x, slightly above the current industry multiple, supported by share buybacks that reduce the share count.
- Flags risks around reliance on commercial aviation, less diversification after recent simplification, supply chain pressures, execution on new platforms and competition in advanced propulsion and digital offerings.
Fair value in this cautious narrative: US$300.88 per share
Implied premium to this fair value at the last close: about 4.8% overvalued
Revenue growth used in this narrative: 6.65% a year
- Frames GE as heavily exposed to commercial aerospace, with potential long run pressure from stricter climate policies, alternative propulsion technologies and any sustained softness in global air travel.
- Builds in more conservative assumptions, with revenue growth at 5.3% originally, margins easing and earnings holding around US$6.9b, alongside a lower 35.9x P/E to support the earlier US$198.40 target behind this view.
- Sets out what could prove this cautious stance wrong, including resilient air travel demand, strong execution on programs like RISE and LEAP, rising defense budgets and high margin service contracts that support steadier cash flows.
Put simply, one narrative says the current price is still below a higher fair value if GE delivers on aerospace growth and buybacks, while the other treats today’s price as slightly ahead of a more restrained outlook. Laying them side by side gives you a clear range to test against your own expectations for revenue growth, margins and what multiple you think GE should trade on over time.
Do you think there's more to the story for General Electric? Head over to our Community to see what others are saying!
This article by Simply Wall St is general in nature. We provide commentary based on historical data and analyst forecasts only using an unbiased methodology and our articles are not intended to be financial advice. It does not constitute a recommendation to buy or sell any stock, and does not take account of your objectives, or your financial situation. We aim to bring you long-term focused analysis driven by fundamental data. Note that our analysis may not factor in the latest price-sensitive company announcements or qualitative material. Simply Wall St has no position in any stocks mentioned.