Has Gilead Sciences (GILD) Pulled Back Enough To Revisit Its Valuation Story?
Gilead Sciences, Inc. GILD | 0.00 |
- If you are wondering whether Gilead Sciences at around US$132.90 is still offering value or has already priced in the story, this breakdown is for you.
- The share price sits near US$132.90, with returns of 9.3% year to date and 28.3% over the last year, alongside a 4.9% decline over the past week and 3.2% over the past month that may have shifted how some investors think about risk and reward.
- Recent news coverage has focused on Gilead Sciences as a major US pharmaceuticals and biotech name, with ongoing attention on its drug portfolio, pipeline developments, and deal making activity. These themes often feed directly into how investors weigh its growth prospects against current pricing.
- On Simply Wall St, Gilead Sciences currently records a valuation score of 4 out of 6. This sets up a closer look at how different valuation methods stack up and why there may be an even more useful way to think about value by the end of this article.
Approach 1: Gilead Sciences Discounted Cash Flow (DCF) Analysis
A Discounted Cash Flow model estimates what a company could be worth today by projecting its future cash flows and discounting them back to a present value.
For Gilead Sciences, the 2 Stage Free Cash Flow to Equity model uses last twelve months free cash flow of about $9.4b as a starting point. Analyst estimates and subsequent extrapolations point to projected free cash flow of around $15.5b in 2030, with a detailed path of forecasts and extensions through 2035 supplied by Simply Wall St.
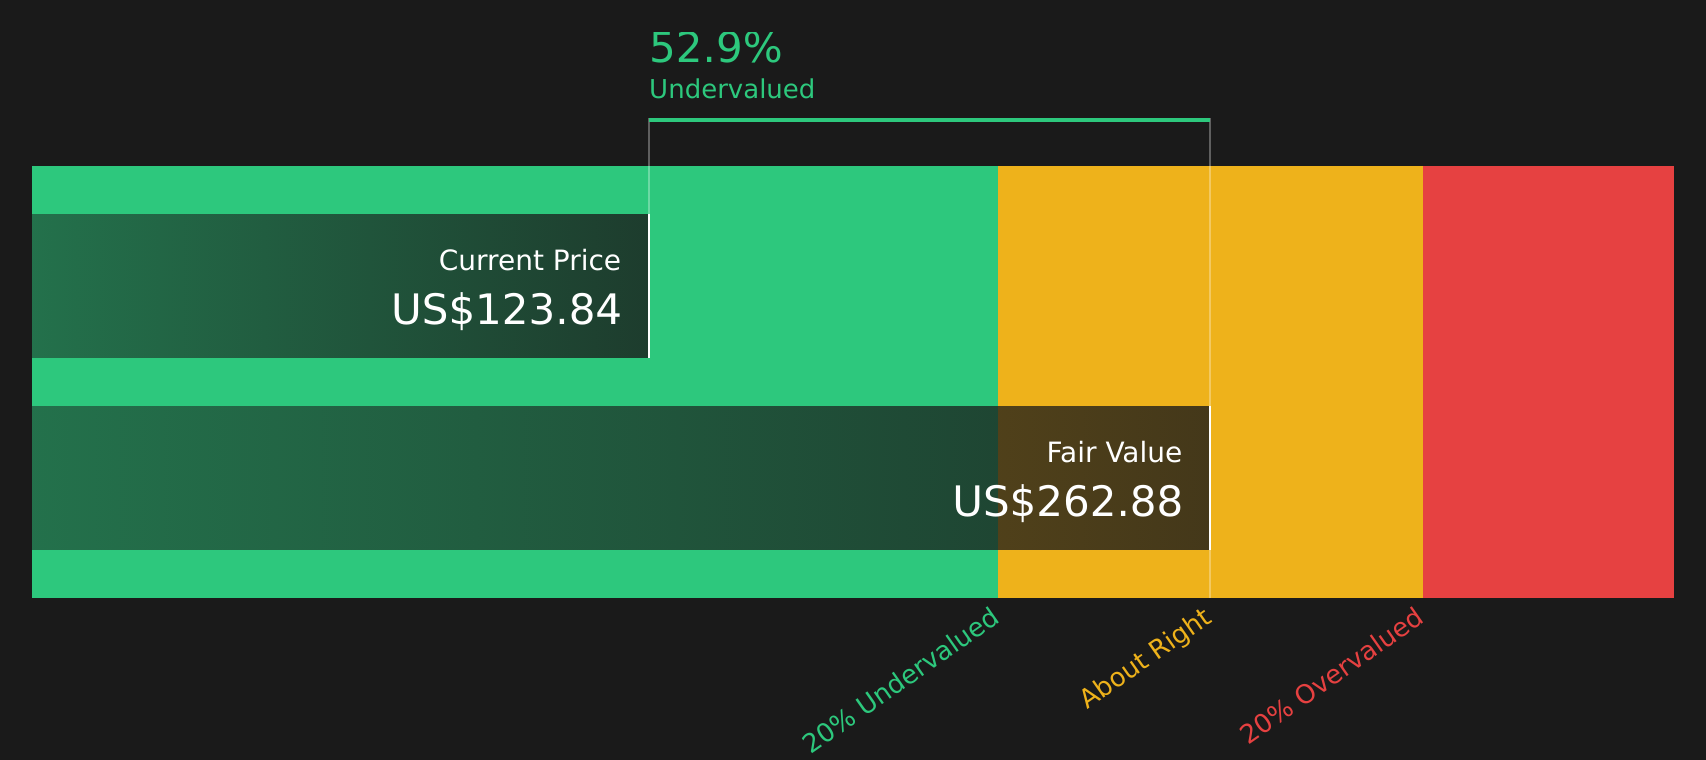
Putting those projections together, the model arrives at an estimated intrinsic value of about $277.01 per share. Against a share price near $132.90, the DCF implies a 52.0% discount, which indicates that the stock currently screens as undervalued on this cash flow based view.
Result: UNDERVALUED
Our Discounted Cash Flow (DCF) analysis suggests Gilead Sciences is undervalued by 52.0%. Track this in your watchlist or portfolio, or discover 61 more high quality undervalued stocks.
Approach 2: Gilead Sciences Price vs Earnings
For a profitable company, the P/E ratio is a useful shorthand for how much investors are paying for each dollar of earnings. This makes it a common way to compare opportunities across the Biotechs space.
What counts as a “normal” P/E partly reflects how fast earnings are expected to grow and how risky those earnings are judged to be. Higher expected growth or lower perceived risk can justify a higher multiple, while slower growth or higher risk usually means investors look for a lower P/E.
Gilead Sciences currently trades on a P/E of about 19.38x. That sits above the Biotechs industry average of roughly 17.01x, but below a peer group average of around 38.52x. Simply Wall St also calculates a proprietary “Fair Ratio” of 25.88x, which is the P/E that might be expected after considering factors such as Gilead Sciences earnings profile, industry, profit margins, market value and company specific risks.
This Fair Ratio can be more informative than a simple comparison with industry or peer averages because it adjusts for the company’s own growth outlook, risk level and profitability rather than assuming all Biotechs deserve the same multiple. With the current P/E of 19.38x sitting below the Fair Ratio of 25.88x, the shares screen as undervalued on this metric.
Result: UNDERVALUED

P/E ratios tell one story, but what if the real opportunity lies elsewhere? Start investing in legacies, not executives. Discover our 19 top founder-led companies.
Upgrade Your Decision Making: Choose your Gilead Sciences Narrative
Earlier it was mentioned that there is an even better way to understand valuation, so meet Narratives, a simple way for you to spell out the story you believe about Gilead Sciences and connect that story to explicit assumptions about future revenue, earnings, margins and a fair value that can be compared with the current share price.
A Narrative on Simply Wall St’s Community page links three pieces together: the business story you believe in, the forecast that flows from that story, and the fair value that those numbers imply. This allows you to quickly see whether your view suggests the stock is priced above or below what you think it is worth.
Because Narratives sit on Simply Wall St’s platform, used by millions of investors, they update automatically when new information such as earnings, guidance or deal news is added. This keeps the fair value in your chosen Narrative aligned with the latest inputs rather than a static spreadsheet.
For Gilead Sciences, one investor might choose a more bullish Narrative that aligns with a fair value of about US$180 per share based on higher revenue growth and margins, while another could pick a more cautious Narrative closer to US$91.83 per share. By comparing each fair value with the live share price, you can decide whether your own view points you toward waiting, adding or trimming exposure.
For Gilead Sciences however we will make it really easy for you with previews of two leading Gilead Sciences Narratives:
Each one connects a clear story about the business to specific assumptions on growth, margins and the P/E multiple that might make sense to you at different share prices.
Fair value in this bull case narrative: US$157.43 per share
Implied discount to that fair value at the recent US$132.90 price: about 15.6% undervalued
Analyst modeled revenue growth used in this narrative: 4.48% per year
- Assumes steady growth in HIV and oncology, with products such as Yeztugo, Trodelvy and Livdelzi improving the product mix and supporting higher margins over time.
- Builds in rising operating efficiency and share buybacks, with analysts expecting profit margins of 32.5% and earnings of US$10.9b by about March 2029 if things go to plan.
- Uses a 22.0x P/E on those 2029 earnings and a 7.31% discount rate to reach a fair value of US$157.43, while still flagging policy, patent and competition risks that could challenge this view.
Fair value in this bear case narrative: US$126.09 per share
Implied premium to that fair value at the recent US$132.90 price: about 5.4% overvalued
Bear cohort revenue growth used in this narrative: 2.16% per year
- Frames Gilead Sciences as facing slower revenue progress, with modest growth assumptions and ongoing pressure from Medicare Part D changes, competition in oncology and cell therapy, and lower Veklury sales.
- Models earnings of US$8.1b and a 29.33% profit margin, with a lower future P/E multiple of 20.86x and a discount rate of 7.30%, which keeps the fair value below the recent share price.
- Highlights that, in this scenario, current pricing already reflects a lot of optimism about HIV and newer treatments, so any missteps on execution or pricing could weigh on returns from here.
Put side by side, these Narratives show you how different assumptions on revenue growth, margins and the multiple the market might pay lead to very different views on what Gilead Sciences is worth today. Your job is to decide which story, or which blend of the two, feels closer to how you see the business and its risks.
To see how these results tie into long-term growth, risks, and valuation, check out the full range of community narratives for Gilead Sciences on Simply Wall St. Add the company to your watchlist or portfolio so you'll be alerted when the story evolves.
Do you think there's more to the story for Gilead Sciences? Head over to our Community to see what others are saying!

This article by Simply Wall St is general in nature. We provide commentary based on historical data and analyst forecasts only using an unbiased methodology and our articles are not intended to be financial advice. It does not constitute a recommendation to buy or sell any stock, and does not take account of your objectives, or your financial situation. We aim to bring you long-term focused analysis driven by fundamental data. Note that our analysis may not factor in the latest price-sensitive company announcements or qualitative material. Simply Wall St has no position in any stocks mentioned.