

Has Nvidia (NVDA) Run Too Far After Its Strong AI Rally This Year?
NVIDIA Corporation NVDA | 0.00 |
- If you have ever wondered whether NVIDIA's share price still makes sense after such a strong run over the years, this article will help you frame that question around what you are really paying for today.
- The stock last closed at US$212.60, with returns of 12.6% year to date and 57.7% over the past year, although it has fallen 4.9% in the last week and is down 1.9% over the last month.
- These short term moves sit against a backdrop of NVIDIA being at the center of major themes like artificial intelligence hardware, data center expansion and advanced graphics. Headlines around AI infrastructure spending, competition in high performance chips and regulatory attention on large technology companies continue to shape how investors think about risk and opportunity in the stock.
- NVIDIA currently has a valuation score of 3/6, which means it screens as undervalued on half of the key checks. The rest of this article will walk through the main valuation methods investors often use and then finish with a broader way to think about what the numbers really mean for you.
Approach 1: NVIDIA Discounted Cash Flow (DCF) Analysis
A Discounted Cash Flow model estimates what a stock could be worth by projecting the company’s future cash flows and then discounting them back to today’s value using a required return. It is essentially asking what all future cash the company might generate is worth in today’s dollars.
For NVIDIA, the model used is a 2 Stage Free Cash Flow to Equity approach. The latest twelve month free cash flow is reported at about $119.4b. Analyst and extrapolated projections have free cash flow at $434.9b in 2031, with a path that includes estimated free cash flow such as $96.0b in 2026 and $540.8b in 2035, all in $. These future cash flows are discounted each year, for example to $86.6b in 2026 and $233.1b in 2031, and then summed to reach an overall equity value.
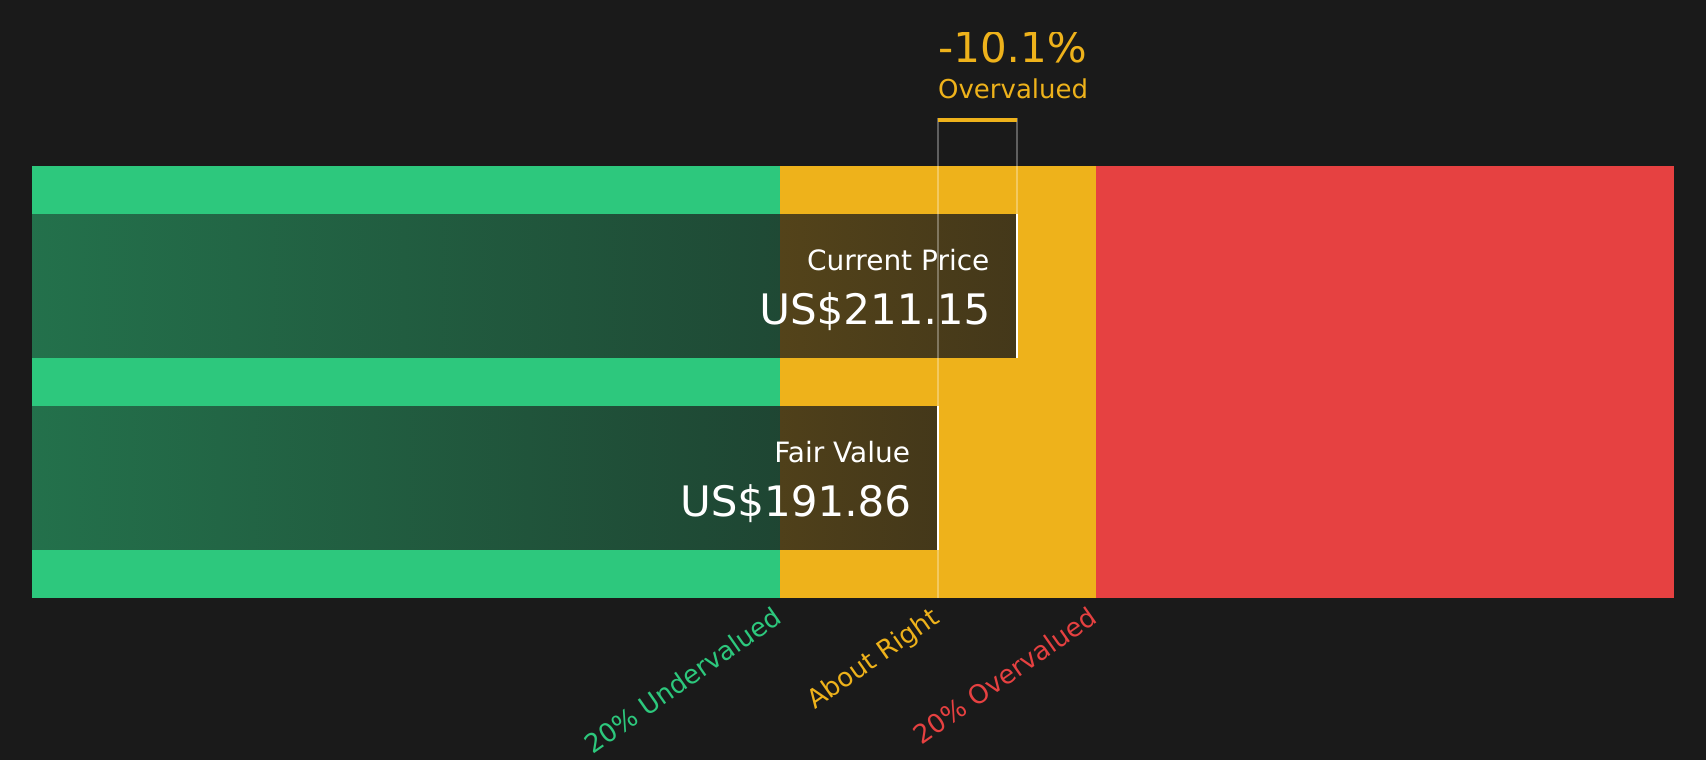
This process results in an estimated intrinsic value of $192.10 per share, compared to the recent share price of $212.60. On this model, NVIDIA screens as around 10.7% overvalued.
Result: OVERVALUED
Our Discounted Cash Flow (DCF) analysis suggests NVIDIA may be overvalued by 10.7%. Discover 47 high quality undervalued stocks or create your own screener to find better value opportunities.
Approach 2: NVIDIA Price vs Earnings
For profitable companies, the P/E ratio is a useful yardstick because it links what you pay for the stock to the earnings it is currently generating. You are effectively asking how many dollars of share price you are paying for each dollar of earnings.
What counts as a “normal” P/E usually reflects the market’s view of a company’s growth potential and risk. Higher expected growth or lower perceived risk can support a higher multiple, while slower growth or higher risk tends to justify a lower one.
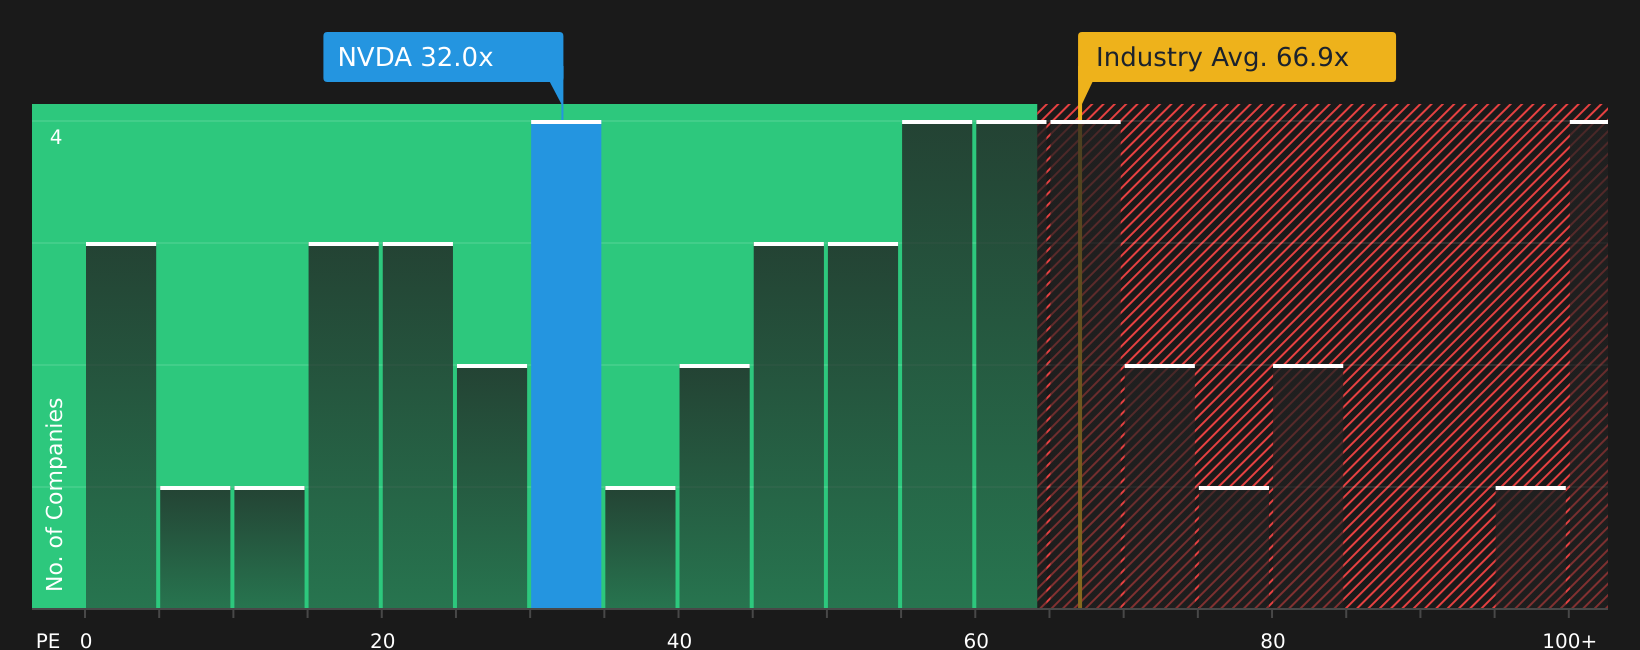
NVIDIA trades on a P/E of 32.26x. This sits below the Semiconductor industry average of 68.18x and also below the peer average of 78.01x in the valuation set used here.
Simply Wall St’s Fair Ratio for NVIDIA is 50.96x. This is a proprietary estimate of what a reasonable P/E could be, given factors like earnings growth, industry, profit margins, market cap and company specific risks. Because it blends these elements, the Fair Ratio can be more tailored than a simple comparison with peers or the broad industry.
Comparing NVIDIA’s current P/E of 32.26x with the Fair Ratio of 50.96x, the stock screens as undervalued on this metric.
Result: UNDERVALUED
P/E ratios tell one story, but what if the real opportunity lies elsewhere? Start investing in legacies, not executives. Discover our 20 top founder-led companies.
Upgrade Your Decision Making: Choose your NVIDIA Narrative
Earlier this article showed how traditional tools like DCF and P/E give you a snapshot of value, but Narratives let you go further by attaching a clear story to those numbers, so you can say not just what you think NVIDIA is worth, but why.
A Narrative is simply your own view of the company, written out as assumptions about future revenue, earnings and margins and the fair value you think that implies, grounded in what you believe about topics like AI data centers, competition or regulation.
On Simply Wall St’s Community page, Narratives turn that story into a full forecast and valuation, so you see a direct link from “NVIDIA can reach US$400b annual revenue from data centers” or “earnings growth fades and the P/E settles near 30x” through to an estimated fair value per share.
Because Narratives live inside the platform used by millions of investors, they are easy to browse and compare, and they update automatically as new information such as earnings, guidance or export control news is added to the model behind the scenes.
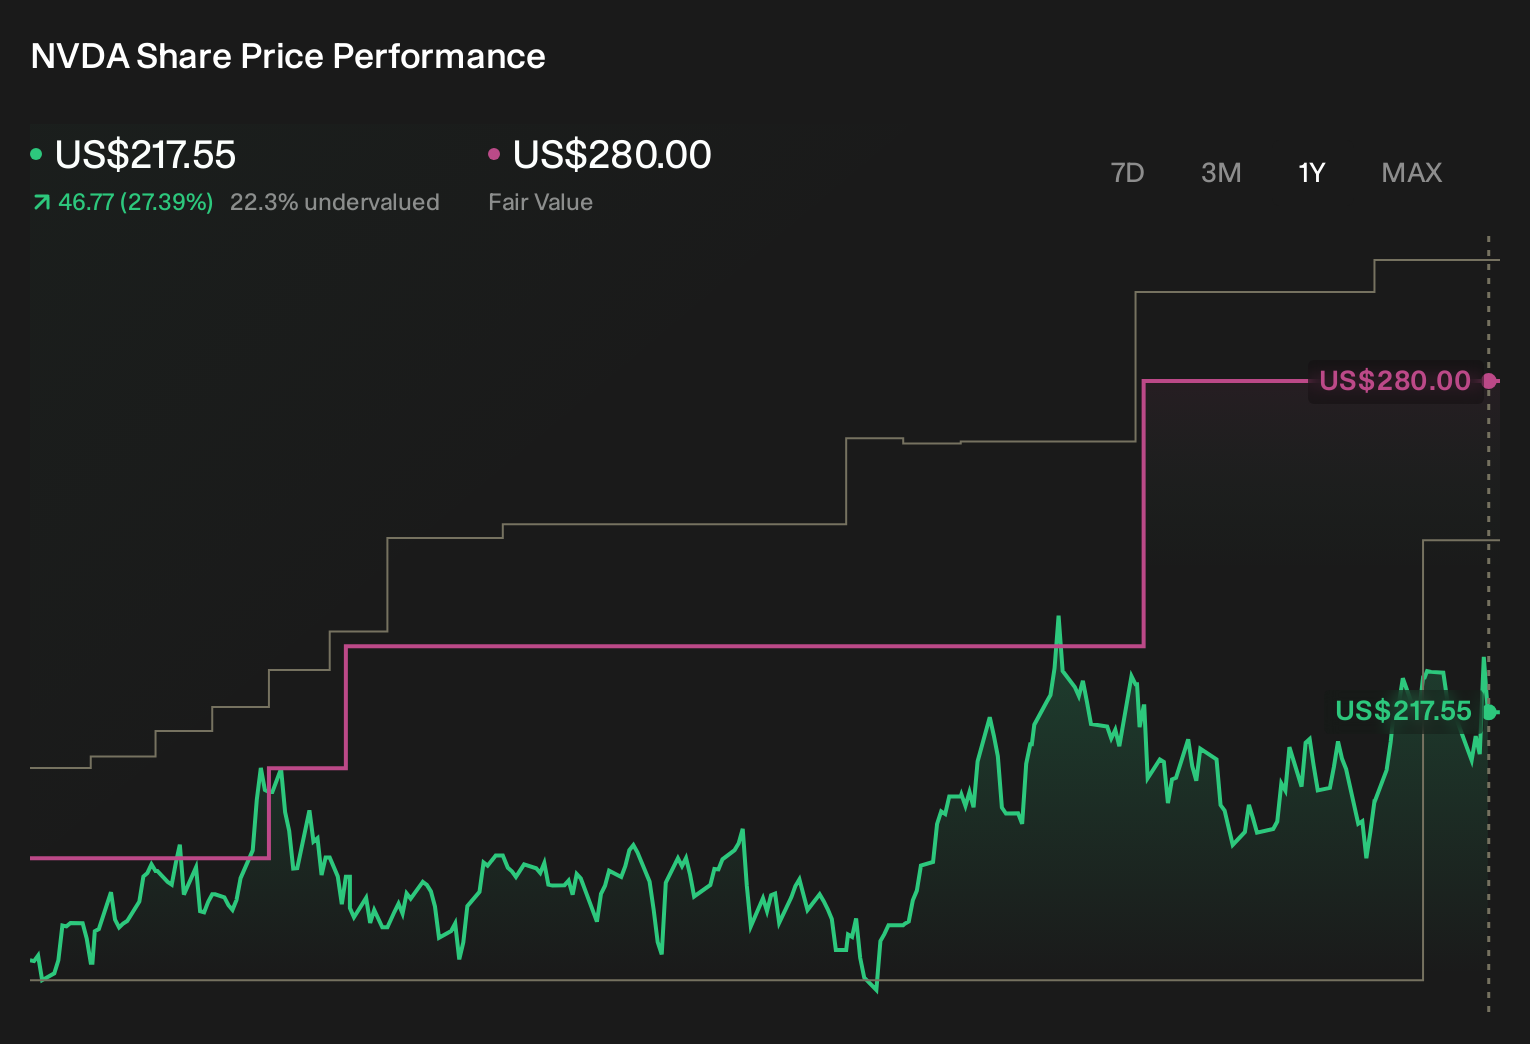
For NVIDIA, that means one investor might anchor on a fair value near US$87 with slower growth and a lower future P/E, while another might lean toward US$335 with faster AI adoption and higher margins. You can immediately see how each Narrative’s fair value stacks up against today’s US$212.60 share price to decide whether their story, not just their number, fits how you want to invest.
For NVIDIA, however, we will make it really easy for you with previews of two leading NVIDIA Narratives:
Together they bracket a wide range of outcomes around the current US$212.60 share price, so you can see how different assumptions about AI, data centers and competition translate into very different views on fair value.
Each Narrative below comes from a community author, with its own fair value estimate, revenue growth assumption and key arguments. Your job is not to pick a “right” answer, but to decide which story looks closer to how you think the next few years could play out.
Fair value in this Narrative: US$339.90 per share
Implied undervaluation vs last close: the price sits about 37% below this fair value, based on ((339.9 minus 212.6) divided by 339.9).
Revenue growth assumption: 30%
- Sees NVIDIA reaching US$400b annual revenue in 5 years, with around 90% coming from data center customers who keep buying successive generations of high end racks.
- Assumes NVIDIA maintains a strong edge in GPU design and the AI software stack, with CUDA remaining the default platform rather than being displaced by cheaper or open source alternatives.
- Flags meaningful execution and policy risks, including competition from other chipmakers, power and data center constraints, and political or regulatory decisions that could reshape demand and energy availability.
Fair value in this Narrative: US$141.74 per share
Implied overvaluation vs last close: the price sits about 50% above this fair value, based on ((212.6 minus 141.74) divided by 141.74).
Revenue growth assumption: 17.2%
- Builds a case that NVIDIA is already deeply embedded in AI, data centers, gaming and automotive, but that current market expectations may be running ahead of more moderate long term growth and margin assumptions.
- Highlights risks around competition in GPUs, possible pressure on gaming GPU pricing and consumer demand, regulatory pushback on deals and AI, and supply chain disruptions.
- Still assumes strong profitability with a 40% net margin and a high future P/E multiple, yet concludes that even on these generous inputs the implied fair value sits well below today’s share price.
Looking across these two Narratives, the same company, products and themes lead to very different answers once you plug in your own expectations for revenue, margins and competition. That is the point of using Narratives alongside tools like DCF and P/E. They force you to be explicit about what needs to happen for NVIDIA stock to look attractively priced or stretched at US$212.60.
If you want to go beyond previews and see how your own view compares to the community and to the valuation tools used earlier, you can review the full set of NVIDIA Narratives, adjust the inputs and decide which story feels closest to the way you want to invest.
Do you think there's more to the story for NVIDIA? Head over to our Community to see what others are saying!
This article by Simply Wall St is general in nature. We provide commentary based on historical data and analyst forecasts only using an unbiased methodology and our articles are not intended to be financial advice. It does not constitute a recommendation to buy or sell any stock, and does not take account of your objectives, or your financial situation. We aim to bring you long-term focused analysis driven by fundamental data. Note that our analysis may not factor in the latest price-sensitive company announcements or qualitative material. Simply Wall St has no position in any stocks mentioned.